Reports 1-1 of 1 Clear search Modify search
AdV-TCS (CO2 laser projector)
gherardini, lorenzini, nardecchia, rocchi, tringali - 23:51 Thursday 15 February 2024 (63287) Print this report
CO2 laser noise injection - ETM RH common step

The goal of the shift was to perform some noise injections on the CO2 lasers by using their piezo (no need for access to the CO2 benches).

Using the calibrations performed during the maintenance [entry 63258], Matteo calculated the amplitude needed to observe in hrec the sinusoidal signal injected at 29 Hz, 68 and 85 Hz following the model reported in VIR-0911A-19. Note that the model is based on the superposition integral between the YAG and the DAS design profile but using the current applied powers. 

WI

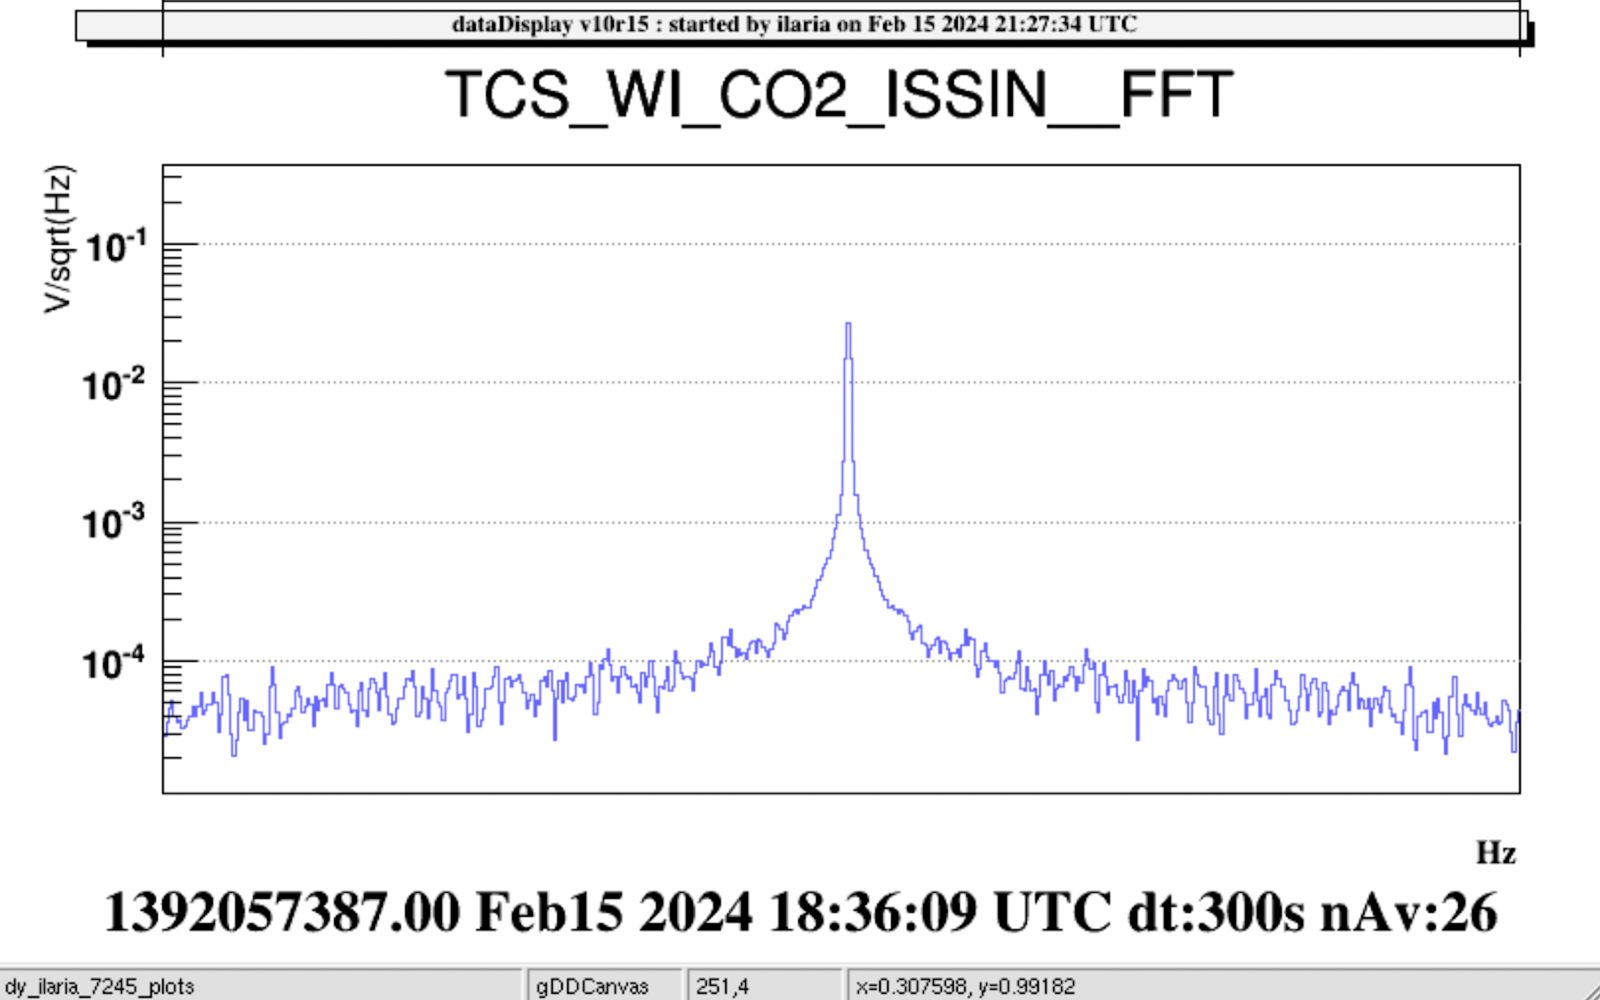
For the WI, the voltage needs to be set on the piezo to measure 10^20 1/sqrt (Hz)) at 29 Hz is 0.006 V. A first injection has been done (at 17.25.20 GPS 1392053138, 300s )) but nothing appeared on hrec. Thus, a subsequent attempt has been done by increasing the voltage up to 0.02 V (the maximum allowed voltage to not saturate the ISSIN signal) but the line didn't appear in the sensitivity curve.

In the table below, the main parameters of the injection are reported.
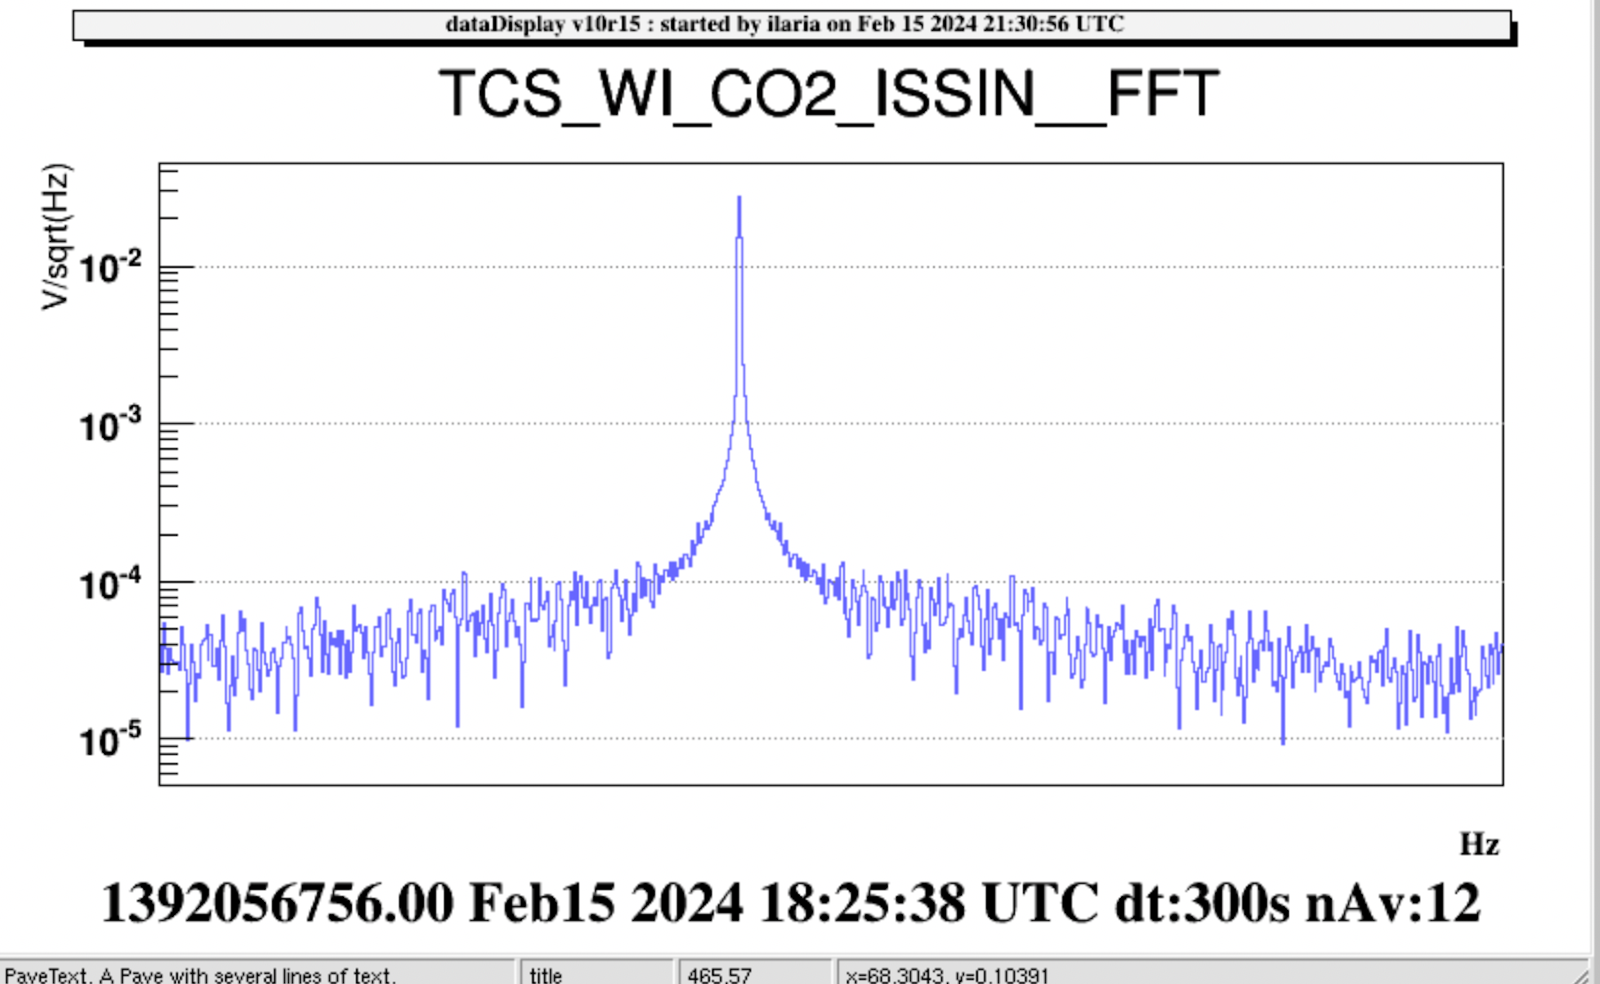
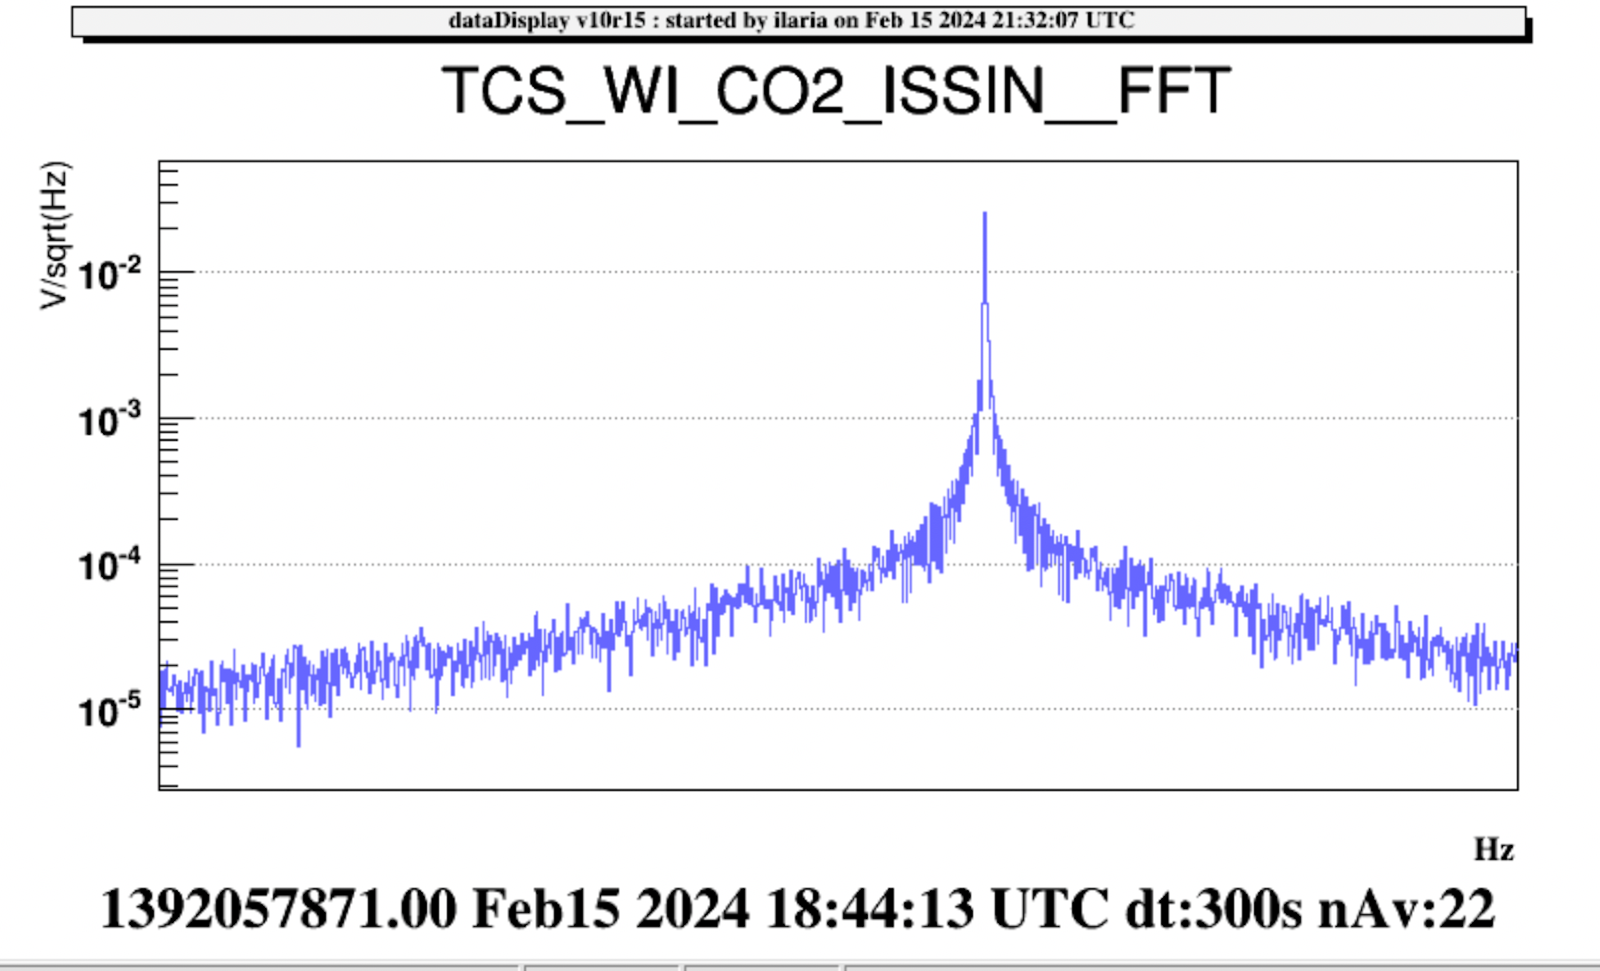
WI

Freq [Hz]

Amplitude [V] 

TCS WI CO2 ISSIN [V/sqrt(Hz)]

Time


29

0.02

0.028

6yXAzD4_DDw7kk1EHT9qqzDgGWyMPwuyYfTshv0tPnTFAQbgr-EmWnw5zb1yCMuhT0VpOErXwdGfl6MPolu_yLmS5Whs7kwbBg_tHZQenl7d_q3AWSTUZ42O4PSZPF8uMOMhly1exhmvKQvutf-R96E

18.29.54 UTC

GPS 1392057012

68

0.02

0.029

zaIj5kjDMU6qvN5ShYYN1rH6syzcnEqNlUzBLCug6JJfCw_WjoZm0BnGjUgDzagJ53UY1zyQboYo3gY6PZDUMX3pS5q-DI70CJYKNWqtfgB7_TPYsc4_rfojrFcp1ye9QGV6tvGKVYHvdhsBJO9w87w

18.22.53 UTC

1392056591

85

0.02

0.027

3CbkFFylDFCsfy3DgkB3x17YQ4YupbTg0Xpwp17JBstK4D5oDUEi3POSx1qk7iI61L7O6TsTa75XbUy0Deqr-Onm-Yo793GXN_X2g9OBEsmq-yEF0Kh7aEYJUTmqlla4_CCW-0uc4eyTjtIpmleOfOM

18.38.58 UTC

1392057556

NI 

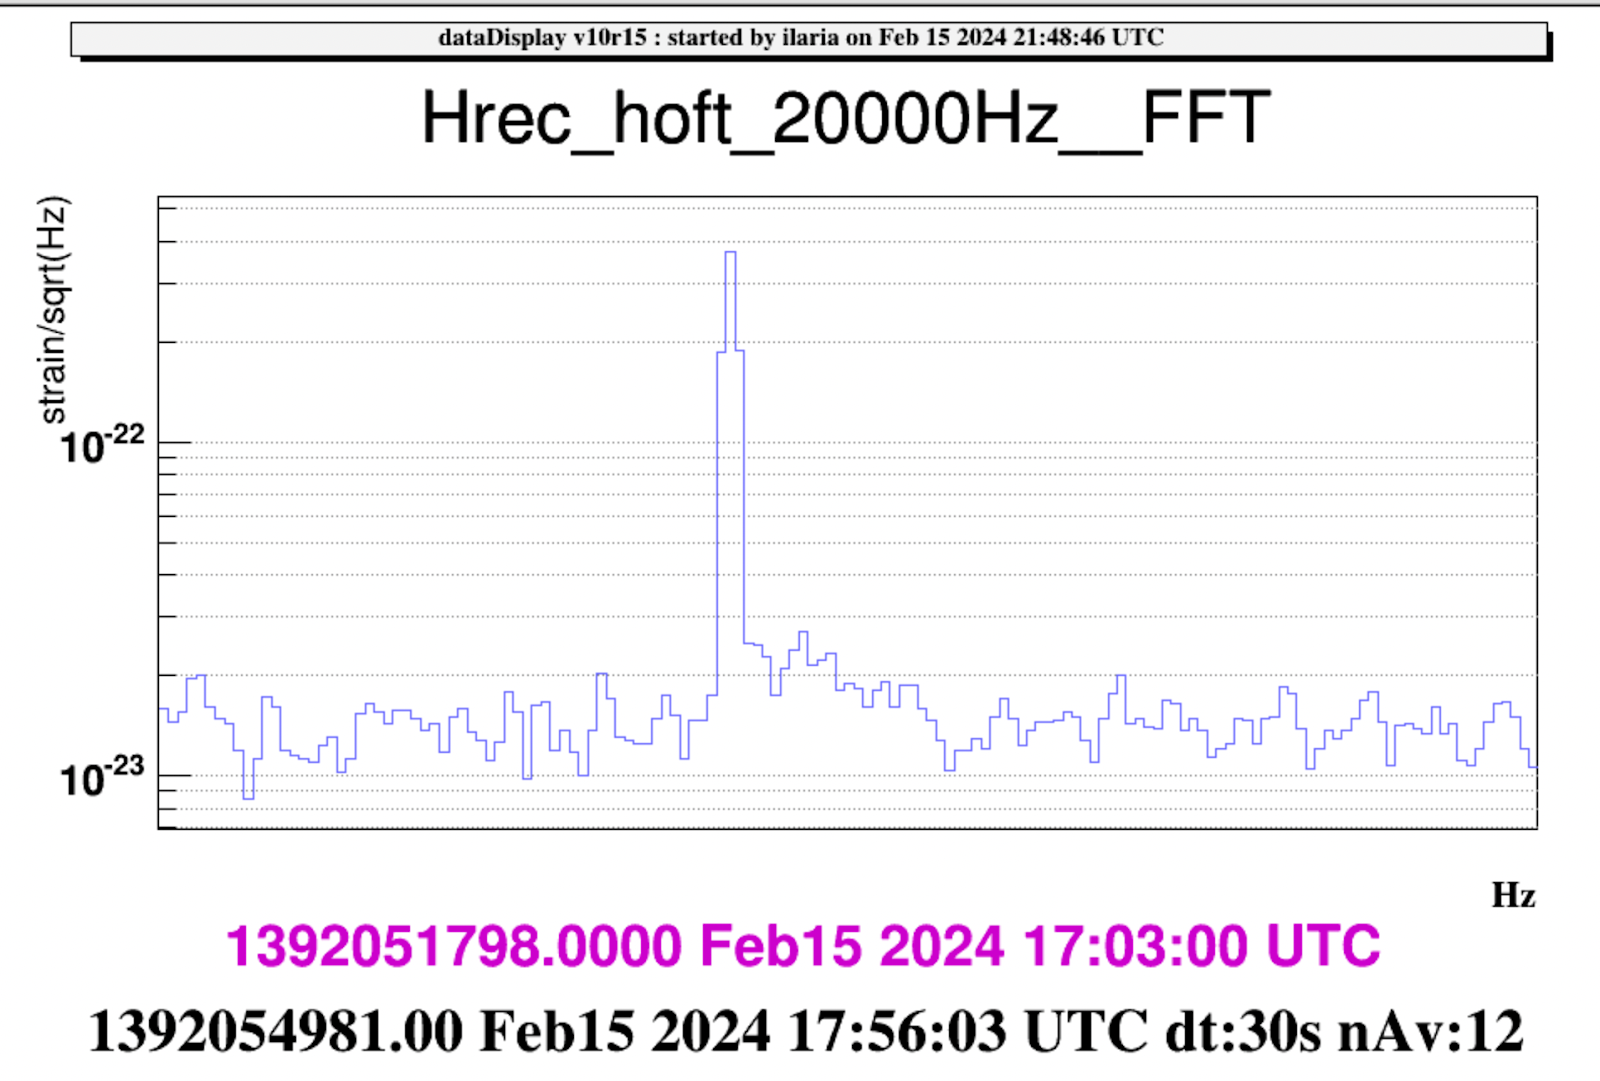
For the NI,  the model predicts that with 4 V applied to the piezo, the expected values in hrec are  2.4*10^-21 1/sqrt(Hz)) at 29 Hz, 1*10^-21 1/sqrt(Hz) at 68 Hz and 8.7*10^-22 1/sqrt(Hz) at 85 Hz, to be compared with the measured ones reported in the table below. The measured values are lower by factor ~ 2 wrt the theoretical one. 

NI

Freq [Hz]

Amplitude [V]

TCS NI CO2

ISSIN [V/sqrt(Hz)]

    Time 

hrec [Measured]

[1/sqrt[Hz]]


29

0.225

UoqnXannoyGt-x3HhydVxS4X6rRDE8uFiw4DMYAtH_AYh2hfN2LcozmYL2o1TRt6OGpf7rNpB9xV1MdoC9xOnErwTwCOH1z4ZLiuDKkLZBAxRT9x-gHocq8vXbUllev2iHjWkSowvYHPxi1ru9tmz6w

17.35.07 UTC

  (300 s) GPS 1392053725

1e-21

 NFnsuBx3c6T2jYKcpe7h4TuhddyfhMsGrTlzV5rxgo3c7OIC16xqDHVeI9Awe6PGIaDUvjITPeR22-GzpNkjgEBwZZ8Fof7zOdYhedaflRebCGdP9G_9OHanzS1qRBN0ELauZ8w_aK0PfJKLwhxKK3g

68

0.187

ii-Ti10XK3d7lW6zp16VC55iebGMjrqsBTeuZAEP-oxdJ8M5RxkGx3e89nHVaYkf_LYM_TZgS5SaJt1HgNenNAXdXagzRgwtXMBOSP45dStPV082vU4M_r5pkTjCc-_4RKMsa077ctZ6uckU9M0l504

17.42.50 UTC

  (300 s) GPS 1392054188

4.5e-22

B_4uXcrfB6fiWUvgFzFngZUG7TFqNyfCN97tO4lq-UBskmajT8Y356eI1i4iHW0dNRzBohDCDyBDQLbKSLxWf53KKb8R2Ofd4VSDxcuQ9BIVQC-vbZxvUz5QHeQG-AaixadeZRKyLBI7ITirSAv7HKU

85

0.198

u63-1DOq6cHur0jZsfVDaUlj3d-irX3yYgtgOwxau4UFRxsc0VfV3rcZE44lduE2Zm9L3kHRBxC3EKThDK9YfOf714RDfLTOZcekD4fQHJfhL_OfLt0KZB2Yhm4k9RDscRqxbernaab18fcJ9KZbL3E

17.53.18 UTC

 (300 s)

1392054816 

3.9e-22

uJLRrcvY6se18Qq8XtksBB_bSJpc9CIJekHIiosEt5icCsZMGYp3FPwyEuRK5CY8dpyrEpHzBiiIoUZwGRPJlY9C40q0JFg_xl8m5gKjQQVMACkS8AxWYqy0Oy-EVLOXuf0RQBSAg0xCdtL5MmoYLNA

18.53 UTC: manual unlock

19.43 UTC: ITF in LN2

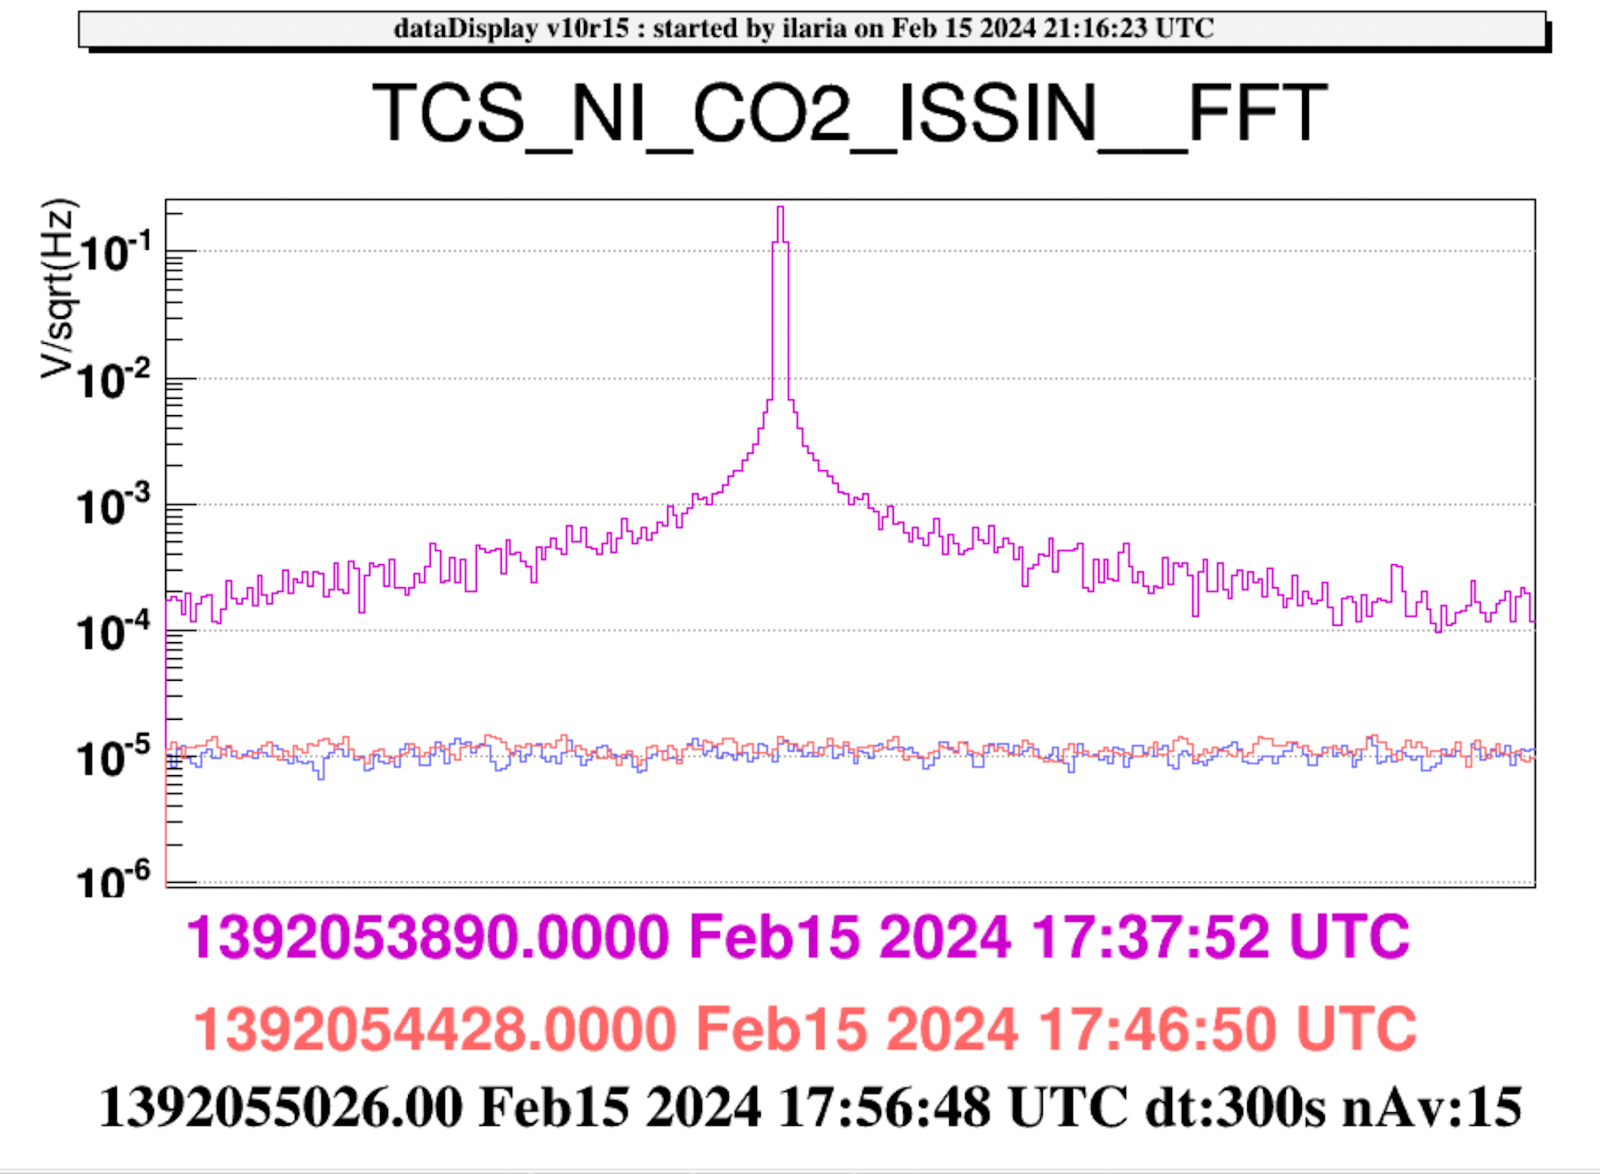
We repeated the noise injection on the NI at 85 Hz in LN2.

NI/ LN2

Freq [Hz]

Amplitude [V]

Time 


85

19.58.59 UTC

 (300 s)

GPS 1392062357

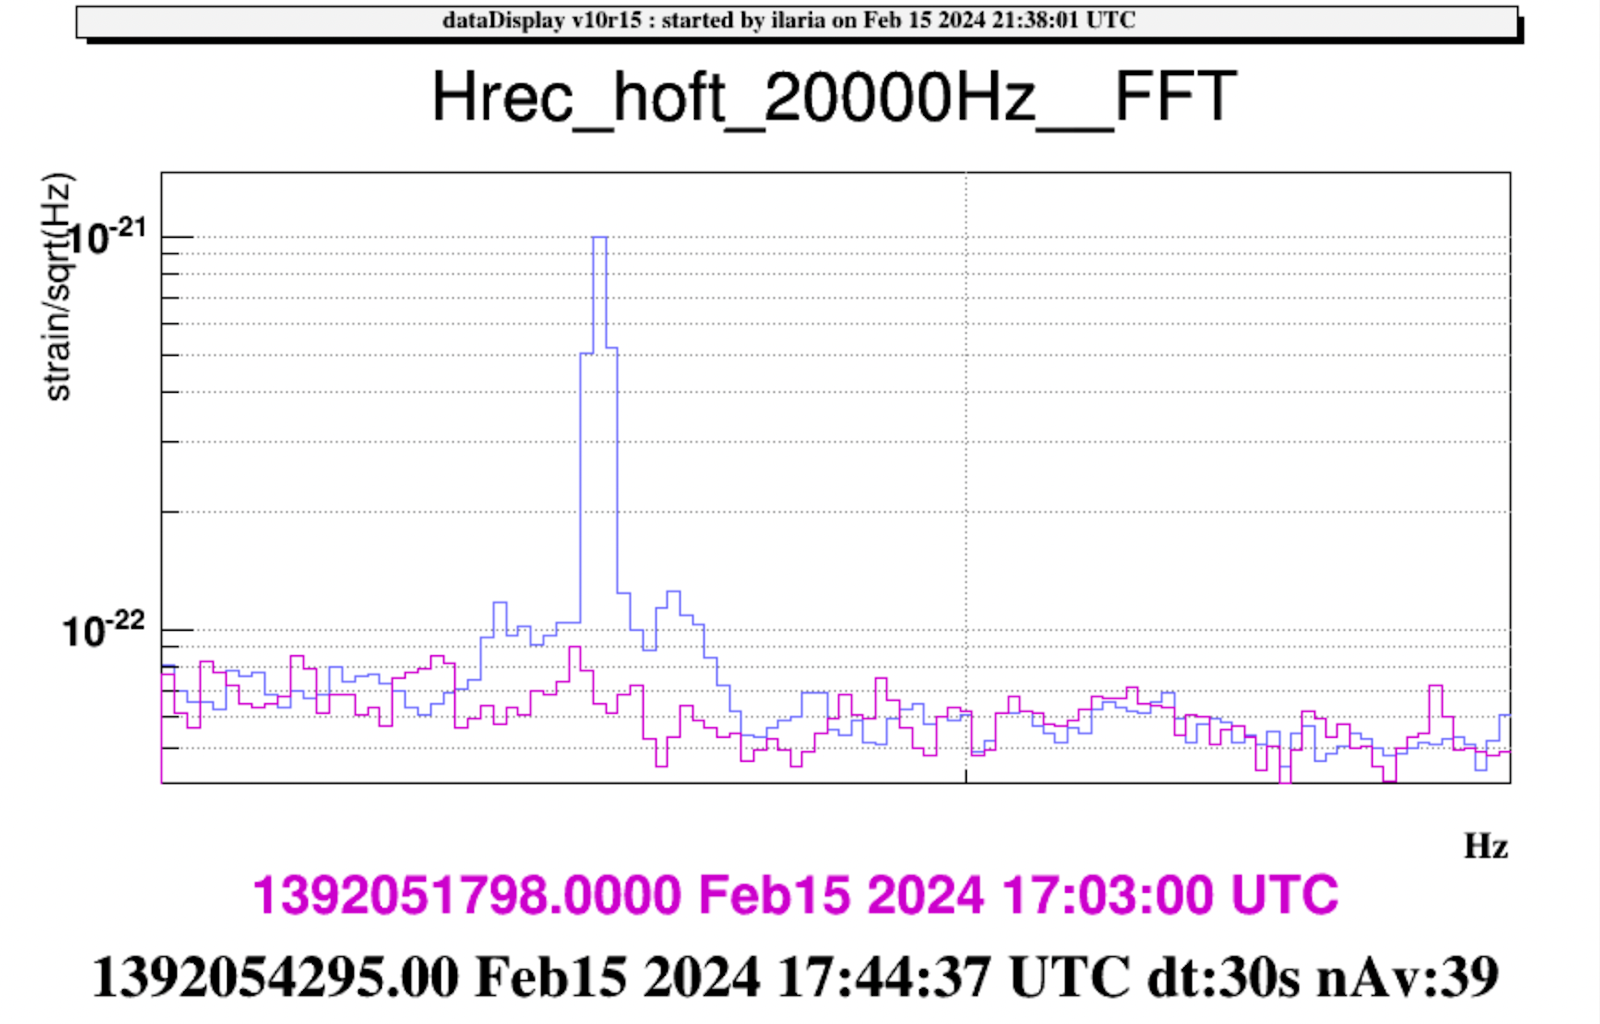
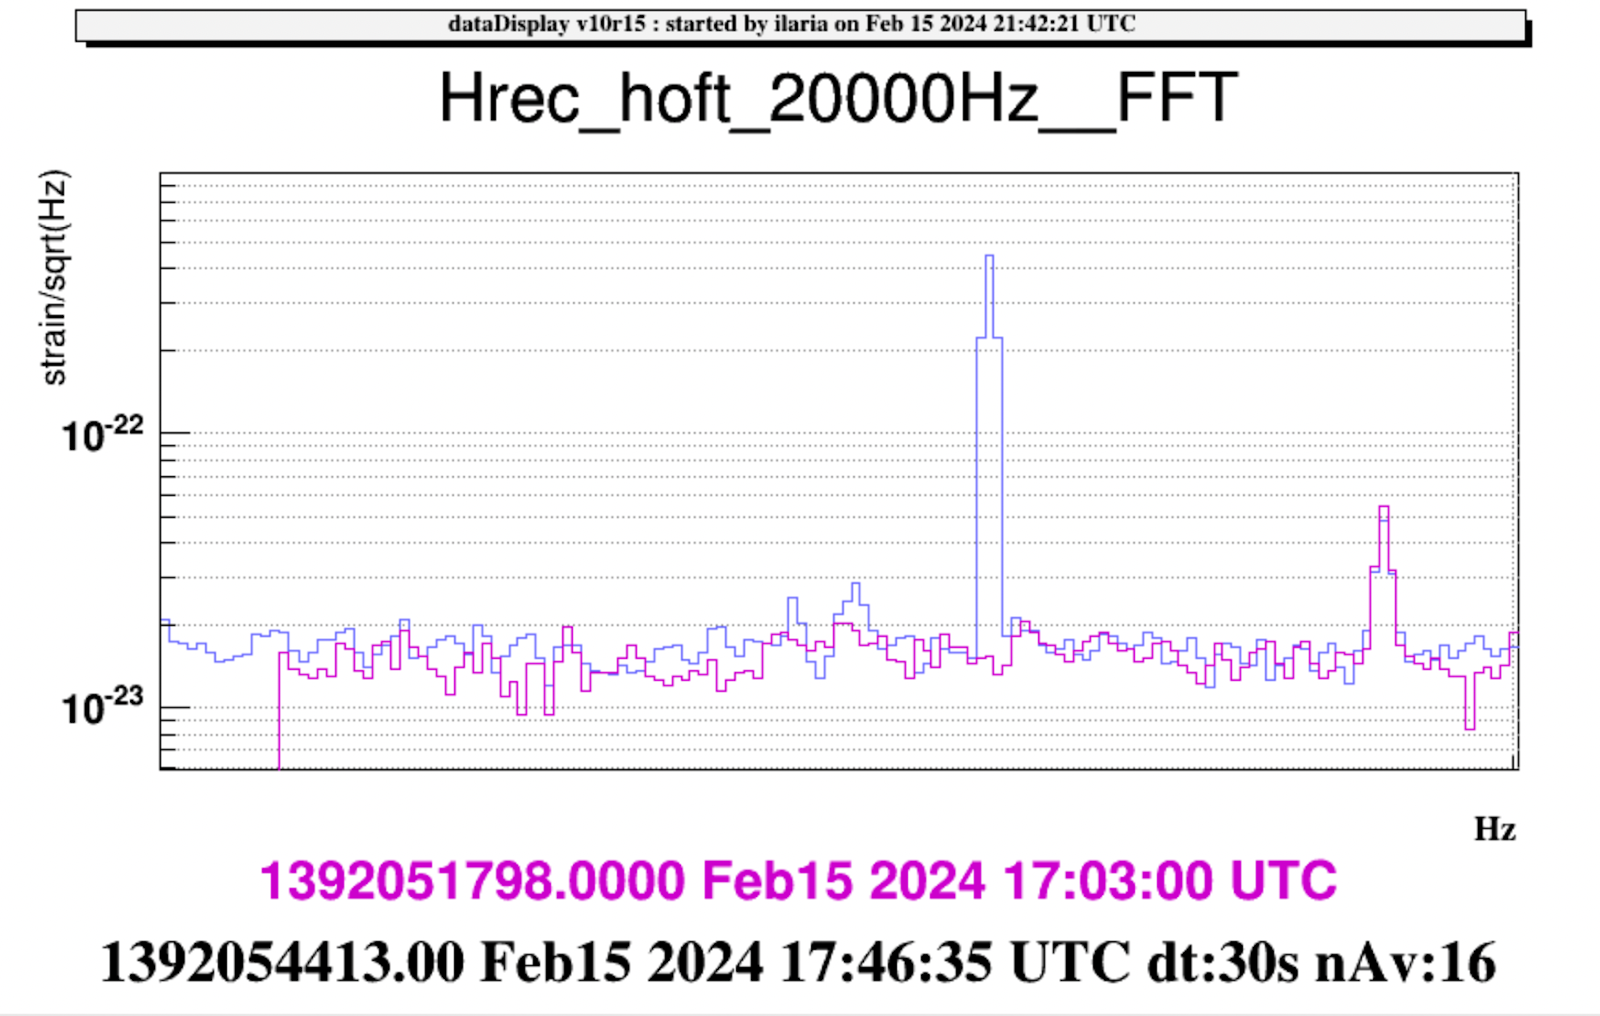
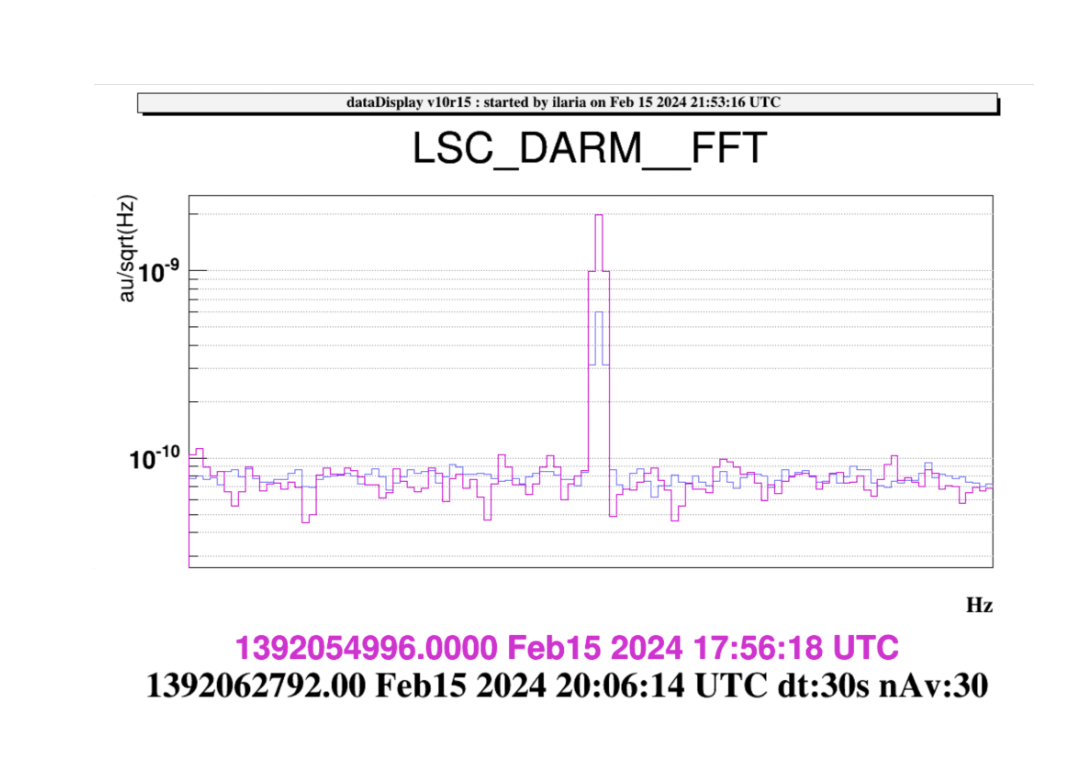
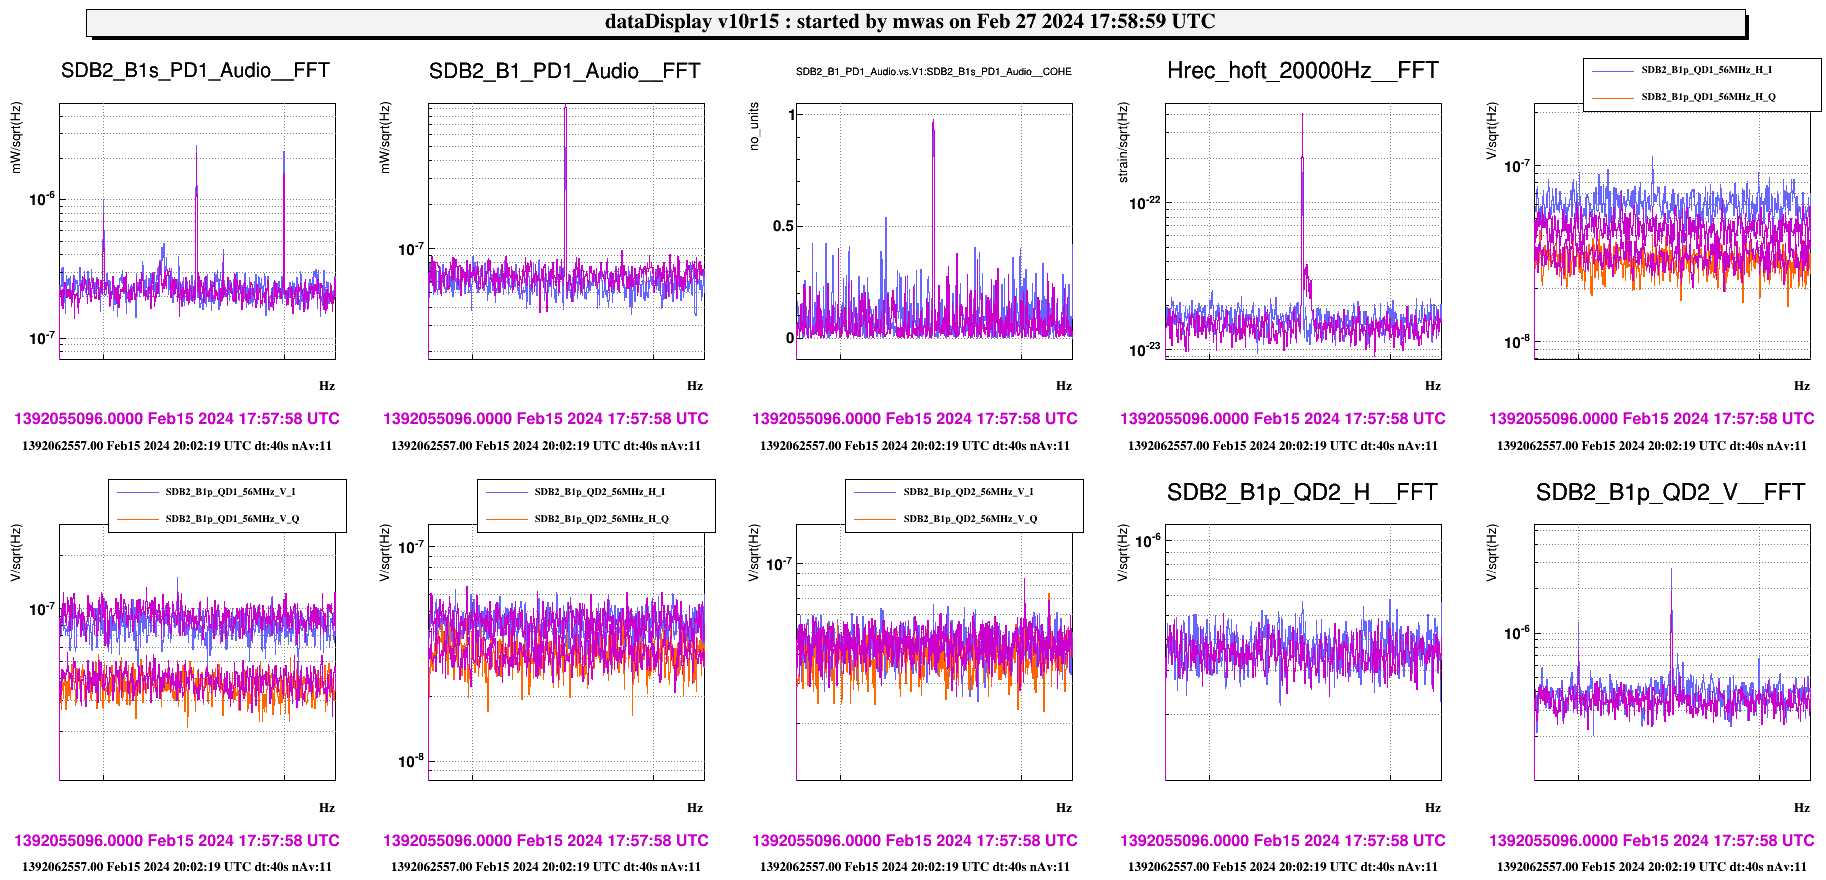
Unexpectedly in LN2 (with SR aligned), the line amplitude is lower wrt the configuration with SR mirror misaligned also in DARM (see fig.1) [ blue: SR aligned, purple SR misaligned].

=========================================================================================================

Once completed the noise injections, in agremeent with Fiodor, a common step has been applied on the ETM RH by increasing their power by 1.5 W.

To date:

NE: P_NE= 3.6W [ V=11.57 V]
WE : P_WE=4.55 W [ V=13.01 V]

At 20.07 UTC, the RH powers have been changed in:

NE: P_NE= 3.6W+1.5= 5.1 W [ V= 13.78 V]

WE : P_WE=4.55 W+1.5= 6.05 W [ V=15.00 V]

Images attached to this report
Comments to this report:
mwas - 21:03 Thursday 29 February 2024 (63449) Print this report

Figure 1 looking at the NI DAS line injection at 85Hz with in blue SR aligned (LN2) and in purple SR misaligned (LN3). The height of the line is lower in Hrec when SR is aligned, but it has the same height on B1s (OMC reflection). Something interesting is that the line is visible on B1p QD2 V but not in the H direction. It coulde mean that the NI DAS injection is modulating a HOM that has is mostly in the vertical direction, or that it creates a vertical beam jitter.

I wonder what it could mean. Is the NI DAS miscentered vertically? Or is it related in some way to the jumps which also correspond to mostly a vertical sideband beam motion?

Images attached to this comment
Search Help
×

Warning

Error

The present report has been modified outside this window. Please check for its integrity in the main page.

Refreshing this page will move this report into drafts.

×