We have performed the analysis of the throughput of the INJ system in the period of 6th May (after the PR centering activity: eLog 55725) to 28th June. The last throughput analysis done is reported here (eLog 55579).
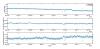
The first attached graph shows the power trend of the transmission of the Mode Cleaner (top graph), the throughput of the injecton system (middle graph), i.e., is the ratio between the calculated power at the output of the PMC (we have estimated 7% losses from the output of the PMC to the output of EIB) and the power at the input of the interferometer (which is estimated to be 7.5% less w.r.t the output of the IMC due to SIB1 losses), and the throughput losses of the Mode Cleaner cavity, i.e., intracavity losses (bottom graph).
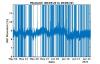
On the other hand, the second graph shows the mismatch of the beam to the IMC cavity. We can see that from the last time the mismatch has increase by roughly 0.5%, while the throughput losses have decreased by around 1.5%.