Reports 1-1 of 1 Clear search Modify search
AdV-SGD (FDS commissioning)
bonnand - 22:34 Thursday 16 June 2022 (56171) Print this report
Trying to understand how to use the PSD to control the SQB1 bench

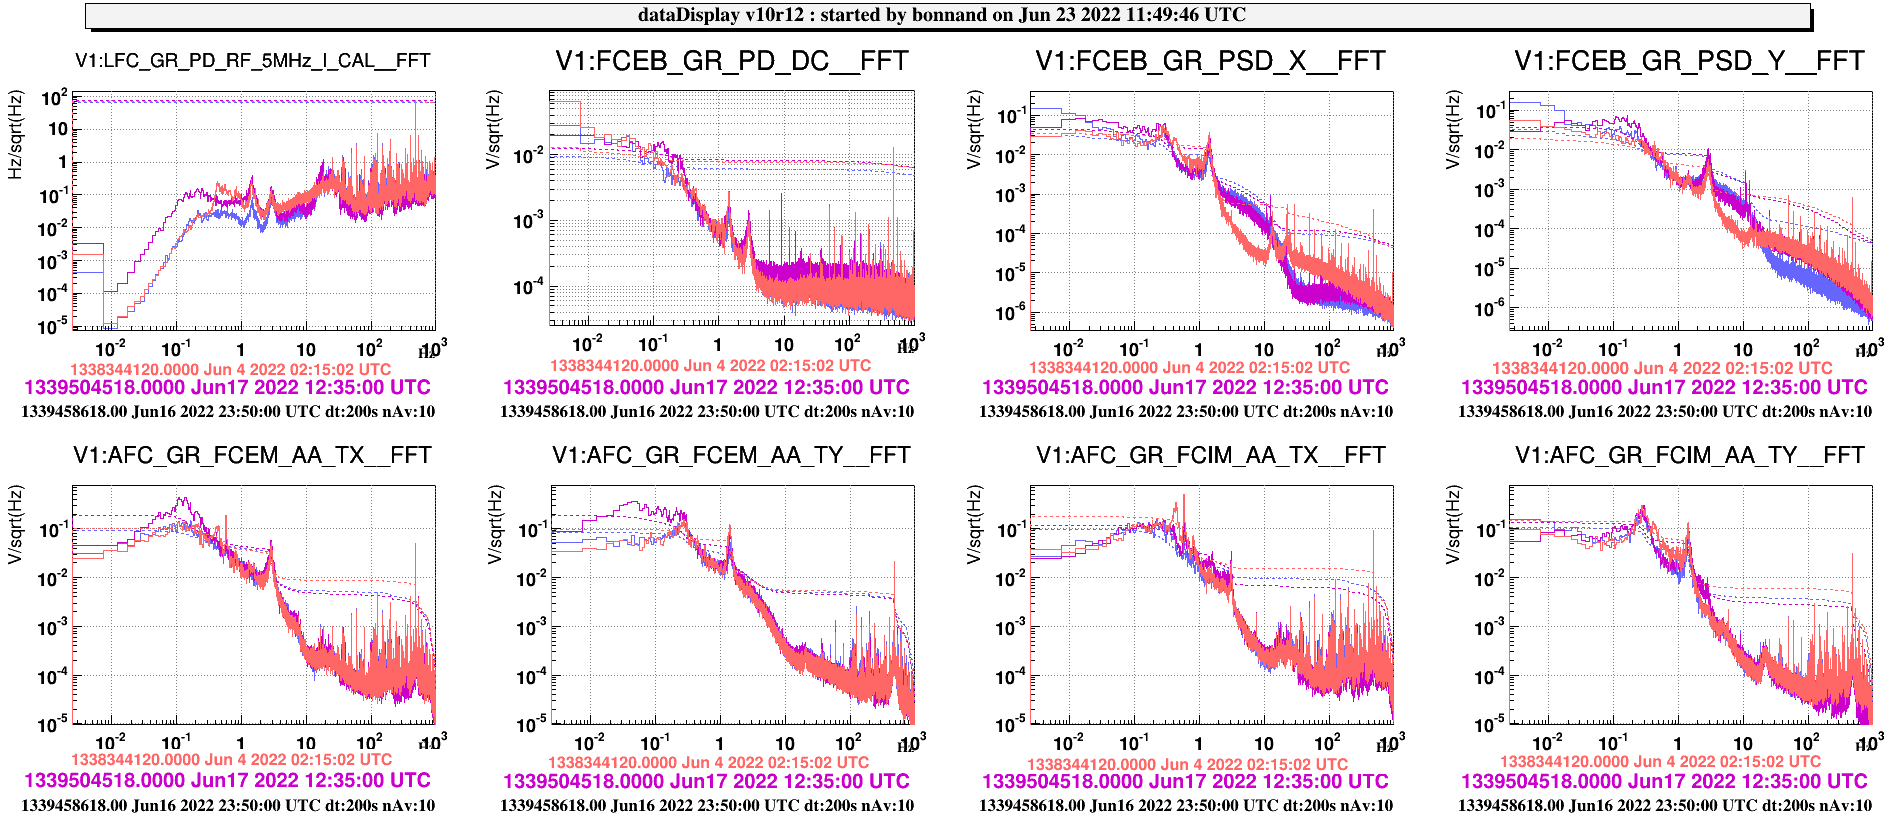
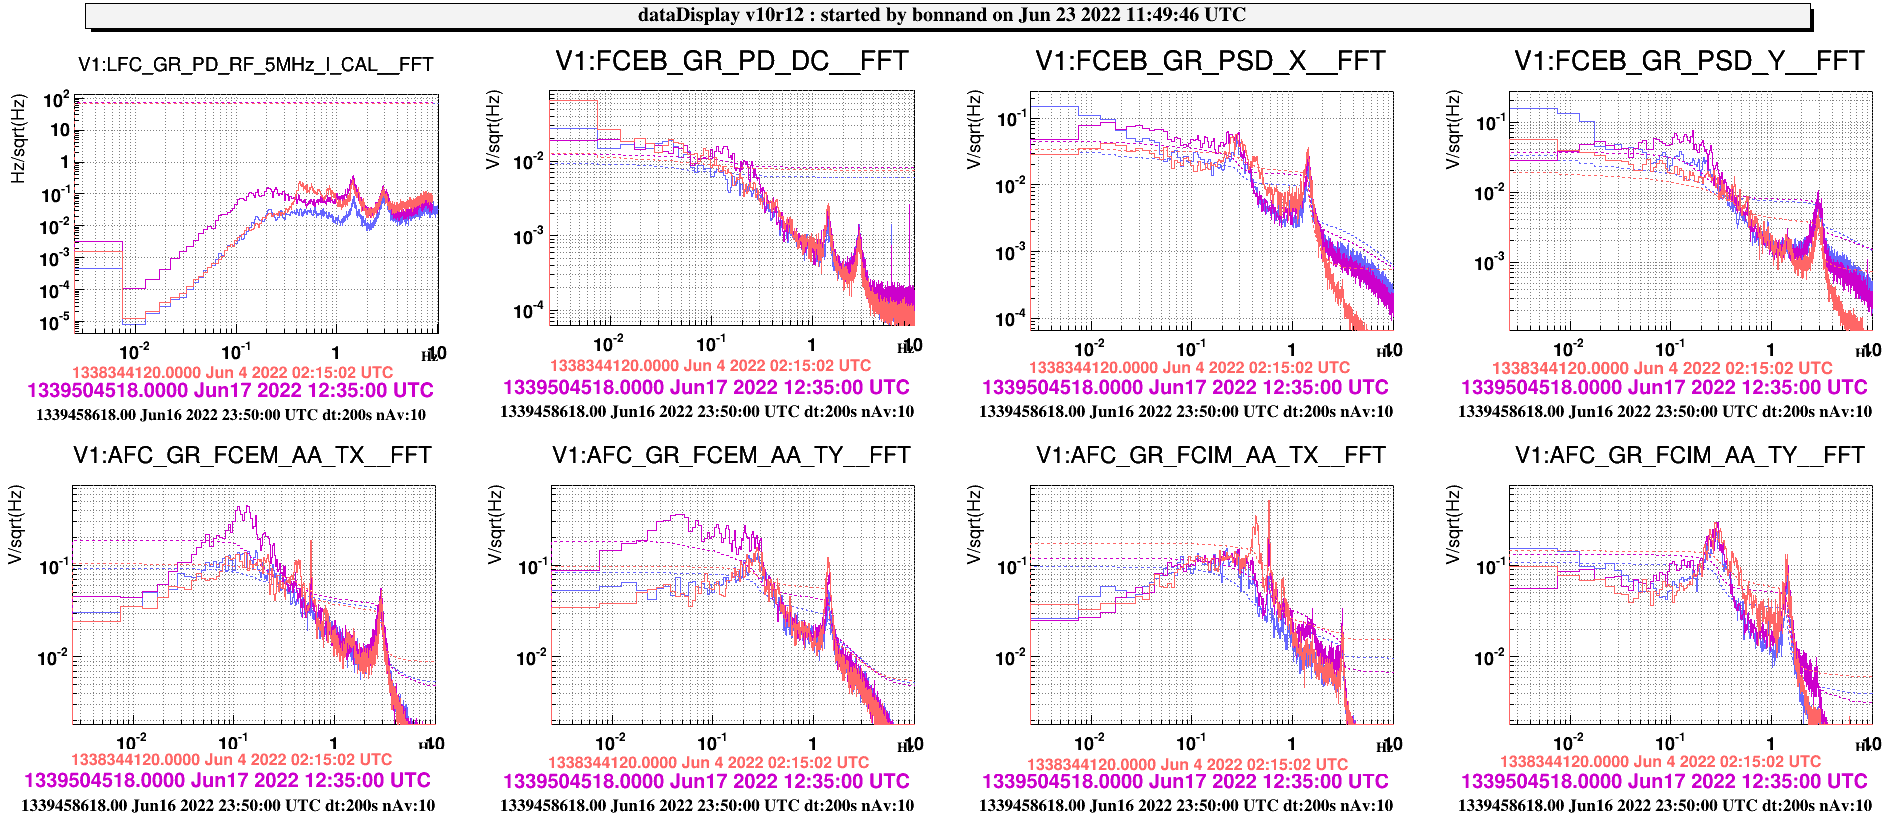
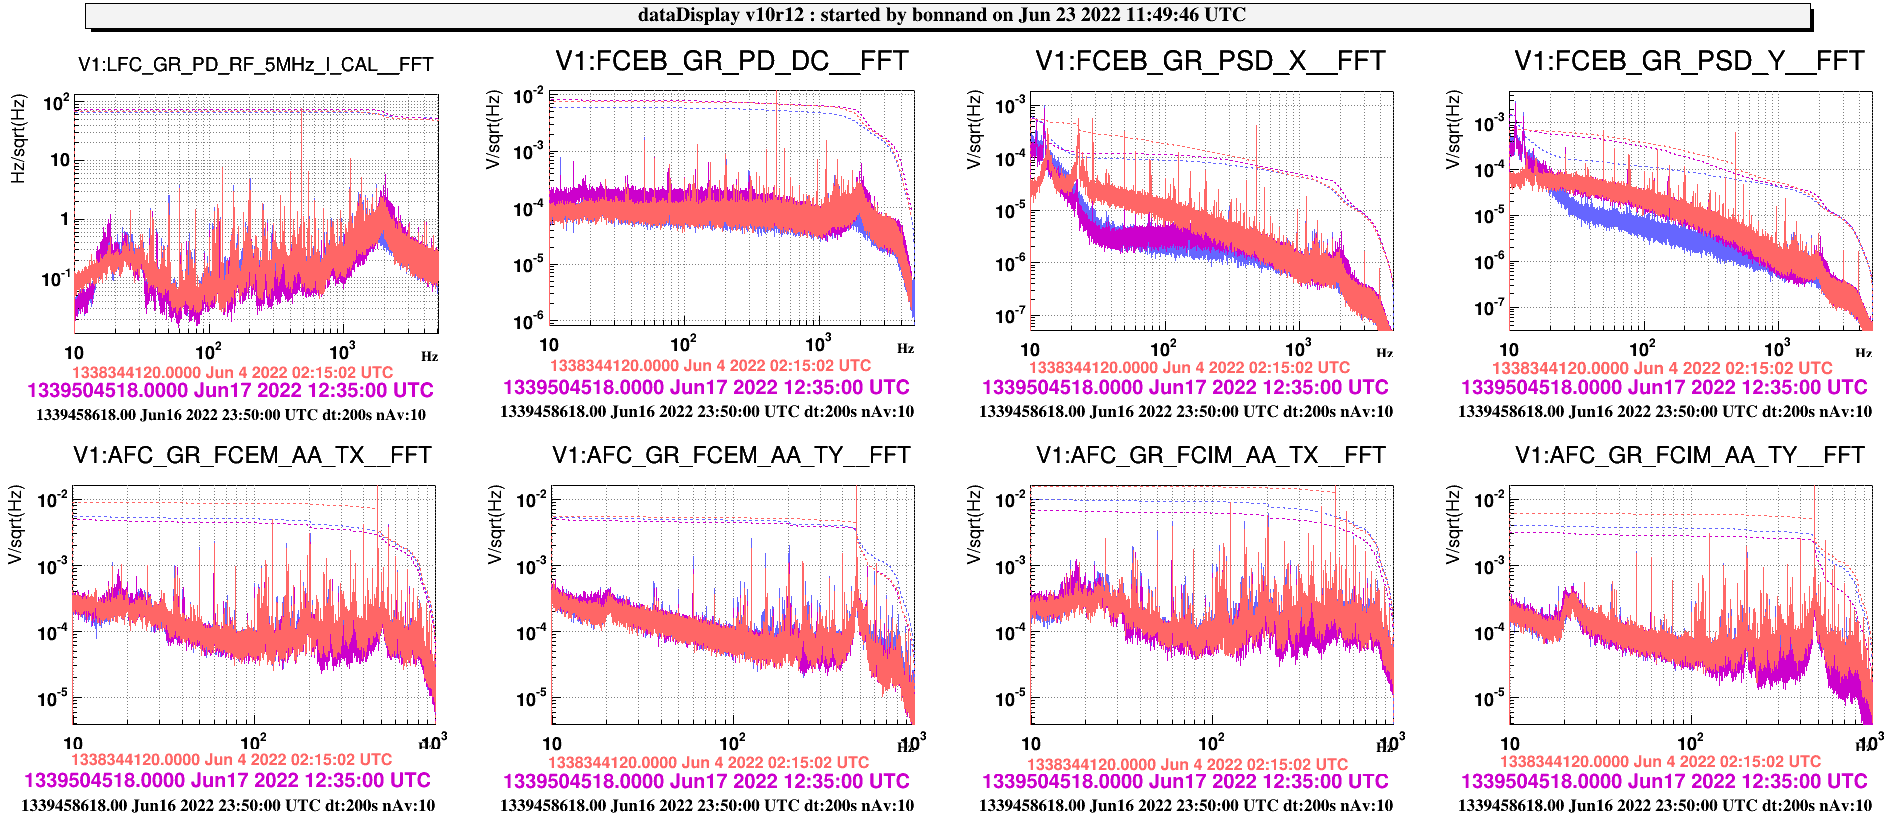
This afternoon, I tried to understand how to use the PSD to control the SQB1 bench (this loop controls TX and TY).

I enabled the bench loop with PSD and adjusted the gain of the loop up to a point where I could see the loop acting, I did that with the GR pointing loop off.

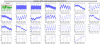
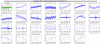
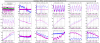
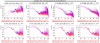
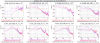
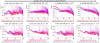
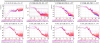
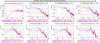
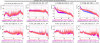
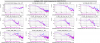
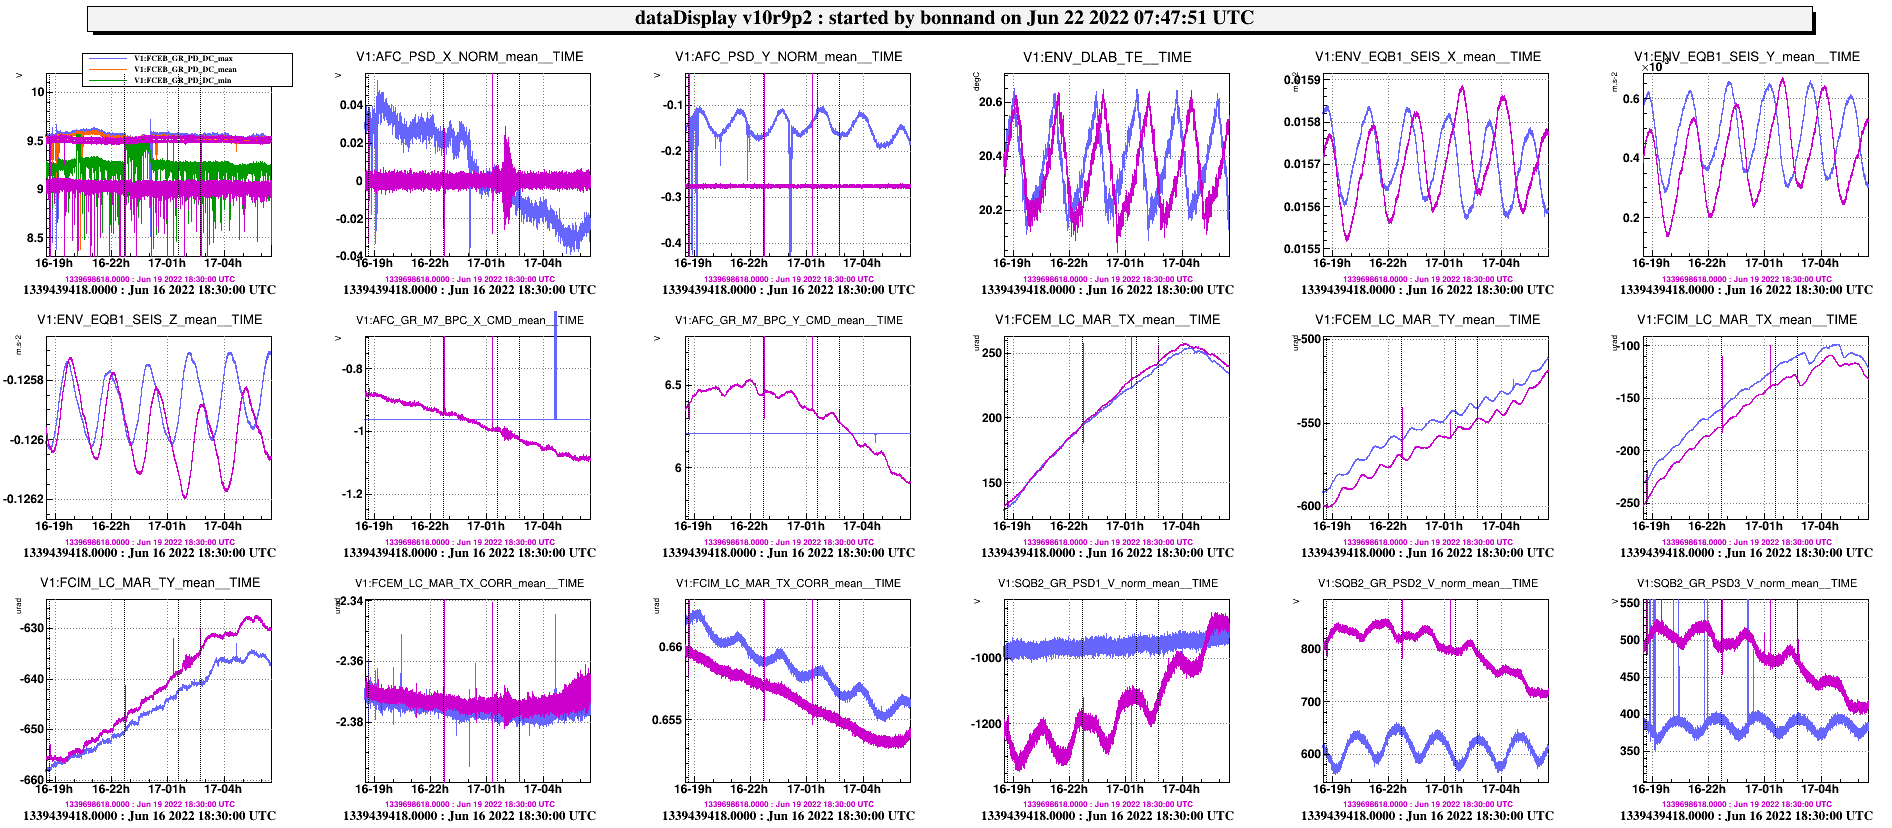
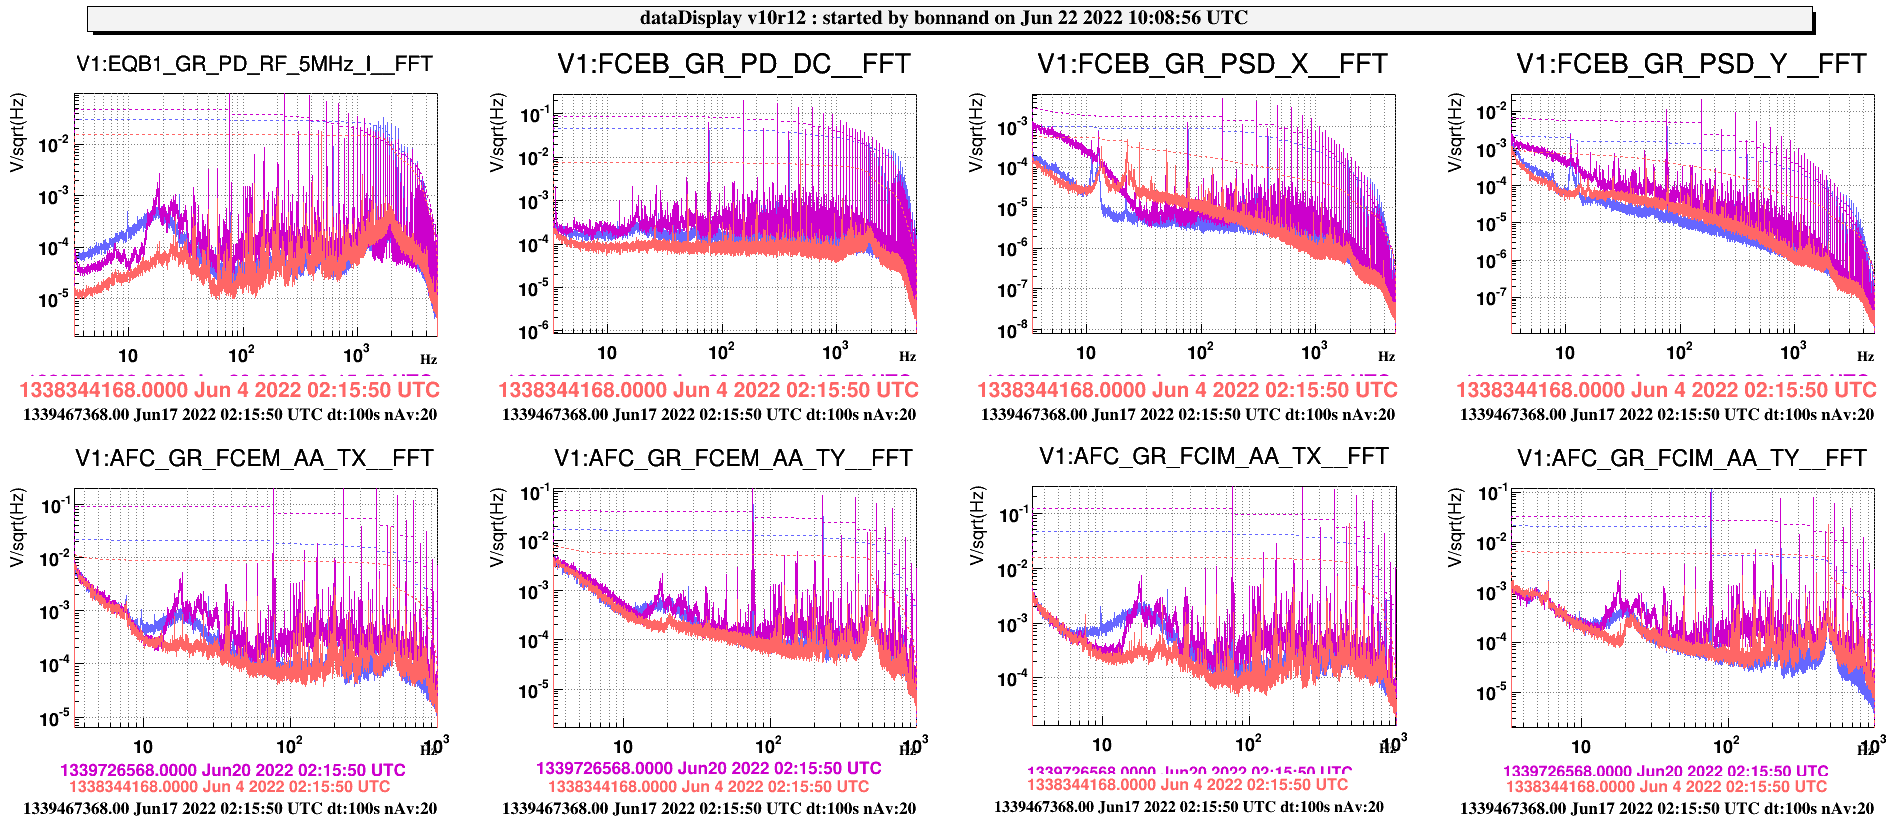
Then I injected white noise (up to 1 Hz) to the PSD error signals for about 1h30 between 15:50 UTC and 17:20 UTC aiming at measuring the transfer function of the loop.

Then I opened the PSD bench loop, close the GR pointing loop again.

Finally I opened the GR pointing loop again and closed the PSD bench loop around 18:23 UTC.

I will leave the system like this for the night (monitoring it to see if it is not going nuts).


I'll try to come up with some analysis later.


Comments to this report:
bonnand - 8:47 Friday 17 June 2022 (56176) Print this report

I've put back the system to the initial condition at 06:42 UTC :

- bench PSD loop opened

- Green pointing ON

bonnand - 16:29 Tuesday 21 June 2022 (56213) Print this report

Fig 1 shows some signals of SQB1 and the FC during the 12h where the PSD drift of SQB1 was ON.

Fig 2 shows the same signals with the PSD drift OFF and the Green pointing (that uses the PSD in transmission of the FC) for comparison.

I remind that both loops do not work at the same time.

One can see that the correction send to control TX (SQB1_LC_TX_corr) when the PSD drift is ON is large compared to when the drift is OFF (1.4 V p-p vs 0.04 V) so the actual motion of the bench is actually much larger in this condition.

It can also be seen in the SQB1_LC_TX signals ( about 25 µrad).

According to Alessandro Bertolini, the tilt of EQB1 bench (and so tilt of the green beam) can be computed as ENV_EQB1_SEIS_Z / g, which gives an oscillation of around 30 urad. This is comparable with the bench motion.

So it seems that by closing the PSD loop of SQB1 we make the bench and ultimately the whole FC to follow the oscillation of the EQB1 bench.

Everything in that condition seems to follow the 2h15 oscillation of the temperature in the DET lab (ENV_DLAB_TE).

One can also observe that overall drift in TX /TY of the FC IM and FC EM  over the 12h with the loop ON and OFF is very similar.

It doesn't seems to be the right way to do this alignment.

To me it would make more sense to steer the green beam on the SQB1 PSDs using the PZT mirrors on EQB1 (GR_M5 and GR_M7) instead of making a suspended bench (SQB1) track an oscillating beam coming from a bench attached to the ground (EQB1).


Images attached to this comment
bonnand, polini, tournefier - 12:43 Wednesday 22 June 2022 (56223) Print this report

Plot 1 shows a comparison of the FC signals over 12h with BPC on and PSD drift off (purple) and with BPC off and PSD drift on (blue) and also the vertical signals of the 3 PSD of SQB2.

  • The FC fluctuation are reduced with SQB1 PSD drift on and no BPC.
  • SQB2_PSD1_V does not see the temperature oscillation of the DET lab (this PSD should be closed to the beam waist).
  • SQB2_PSD2_V sees the temperature oscillation of the DET lab (this PSD should be in far field).
  • The temperature oscillation is clearly imprint on FCIM_LC_MAR_TX_CORR.

Following the first observation I plotted the FFT of the FC error signals both the longitudinal signals and AA signals in 3 different conditions, see last 3 plots (wide frequence range, zoom at low frequencies, zoom at high frequencies):

  • Orange : BPC off - SQB1 PSD loop off (4th of June).
  • Purple : BPC on - SQB1 PSD loop off (20th of June).
  • Blue : BPC off - SQB1 PSD loop on (17th of June).

It looks like to me that the BPC is introducing noise both to the longitudinal and angular controls of the filter cavity in all frequencies range.

This observations seems to be also true for the SQB1 PSD loop but the noise introduced is lower than with the BPC and excluding between 0.2 and 1 Hz where the noise is lower especially for AFC_GR_FCIM_AA_TX/TY signals and the longitudinal signal (EQB1_GR_PD_RF_5MHz_I).


Images attached to this comment
bonnand - 14:38 Thursday 23 June 2022 (56240) Print this report

Following discussion during the QNR meeting this morning, it appears that the noise at high frequencies is due to the OPA scanning.

So I replot the same signals (FTT) (changing EQB1_GR_PD_RF_5Mhz_I by its calibrated signal: LFC_GR_PD_RF_5MHz_I_CAL) when the OPA was locked.

As previously :

  • Orange : BPC off - SQB1 PSD loop off (4th of June).
  • Purple : BPC on - SQB1 PSD loop off (20th of June).
  • Blue : BPC off - SQB1 PSD loop on (17th of June).

Plot 1 is the FFT unzoomed, plot 2 is zoomed at low frequencies, plot 3 is zoomed at high frequencies.

The noise at high frequencies seems to be sensibly the same for the 3 conditions as would be expected as BPC and SQB1 PSD loop act at low frequencies. This is not true for FCEB_GR_PSD_X/Y.

Concerning low frequencies :

  • LFC error signal (LFC_GR_PD_RF_5MHz_I_CAL) seems to be improved between 3 and 30 Hz with SQB1 PSD loop and seems to be worsen with BPC on below 30 Hz compared to no loop on green pointing.
  • FCEB_GR_PD_DC is slightly worse between 0.1 and 0.3 Hz compared to the other 2 conditions.
  • AFC_GR_FCEM_TX/TY (angular error signals of FCEM) is worst with BPC ON below 0.3 Hz compared to the other 2 conditions.
  • AFC_GR_FCIM_TX/TY (angular error signals of FCIM) is more difficult to described.
  • For the 4 angular errors  signal of the FC mirrors, the peaks between 0.3 Hz and 2 Hz are reduced with SQB1 PDS loop.


Images attached to this comment
bonnand - 10:12 Friday 01 July 2022 (56324) Print this report

I have been asked to check the seismic noise during the time I did the FFT.

So I reploted the FFT of the FC control signal with BPC ON in blue (Jun 17th 12:20 UTC) and OFF in purple (Jun 4th 02:00 UTC, time stamp is incorrect in the plot).

The excess of noise below 0.3 Hz in the signals AFC_GR_FCEM_AA_TX/TY and LFC_GR_PD_RF_5MHz_I_CAL while the BPC is ON cannot be explain by a higher seismic noise.

On the contrary the broad peak between 0.3 Hz and 1 Hz in LFC_GR_PD_RF_5MHz_I_CAL purple trace (BPC off) could be explained by higher seismic noise at those frequencies.

Images attached to this comment
Search Help
×

Warning

×