Reports 1-1 of 1 Clear search Modify search
Detector Characterisation (Glitches)
verkindt - 23:21 Wednesday 11 September 2019 (46900) Print this report
detchar hardware injections

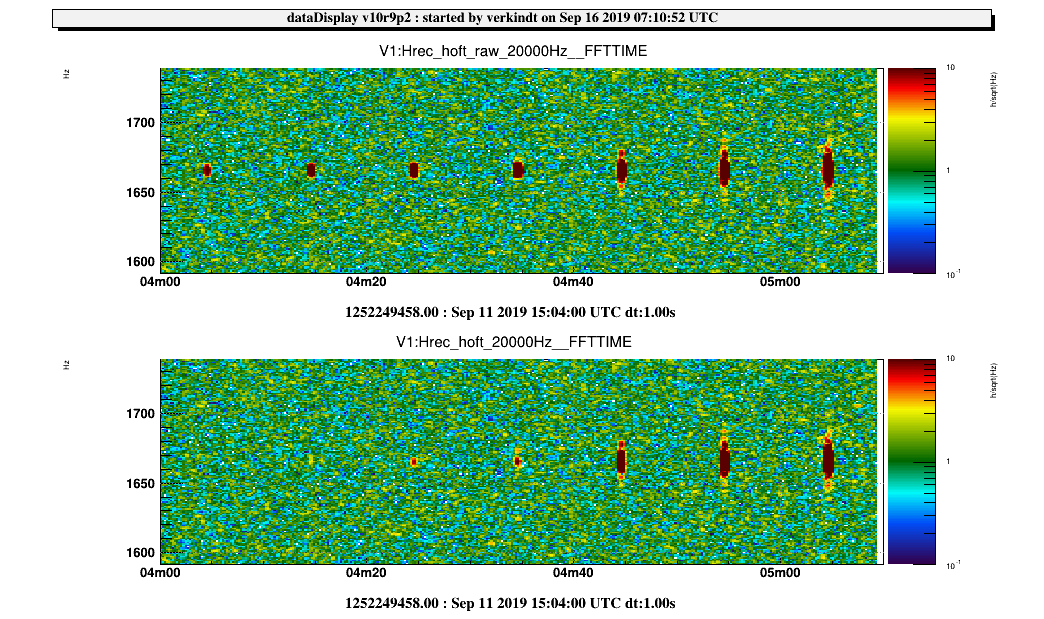
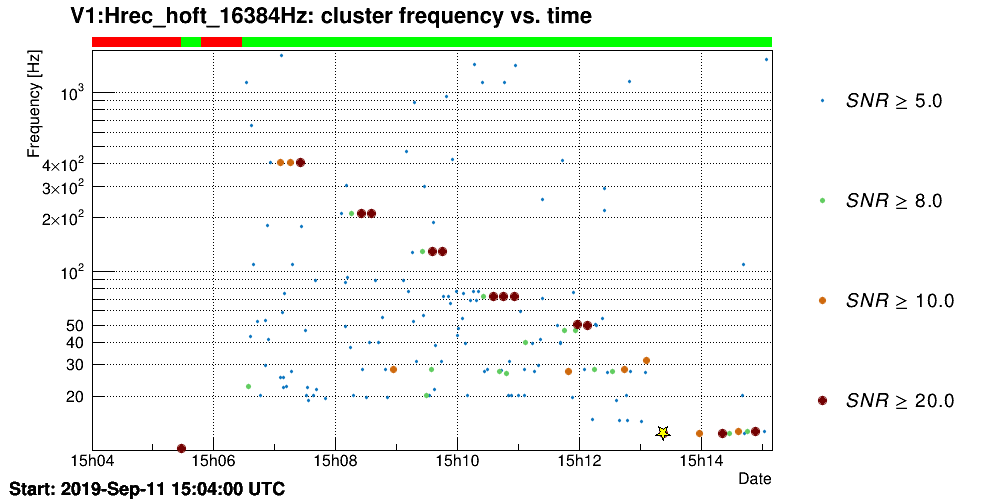
2019-09-11 15h04 UTC, I have injected on NE a set of Detchar HI of various frequencies and SNR.
The input file, prepared by Nicolas Arnaud, contained sine-gaussian signals (damping size of 0.1 sec , frequency f) sampled at 10 kHz.
The injected signals, with 10 sec between them, were the following:

15:04:00 UTC : f=1667 Hz : SNR=40,80,160,320,640,1280,2560
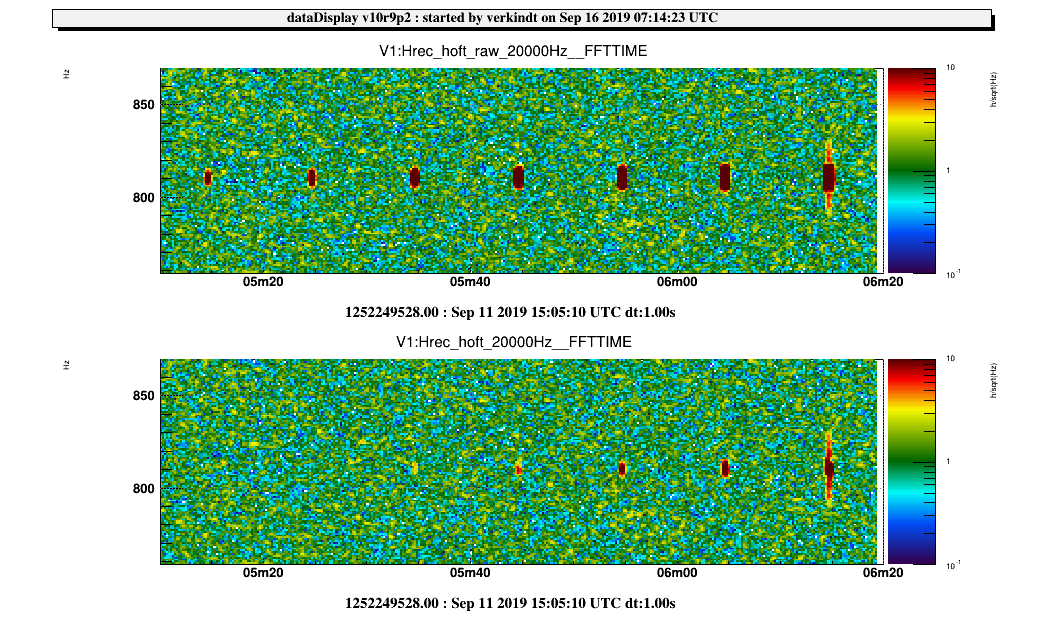
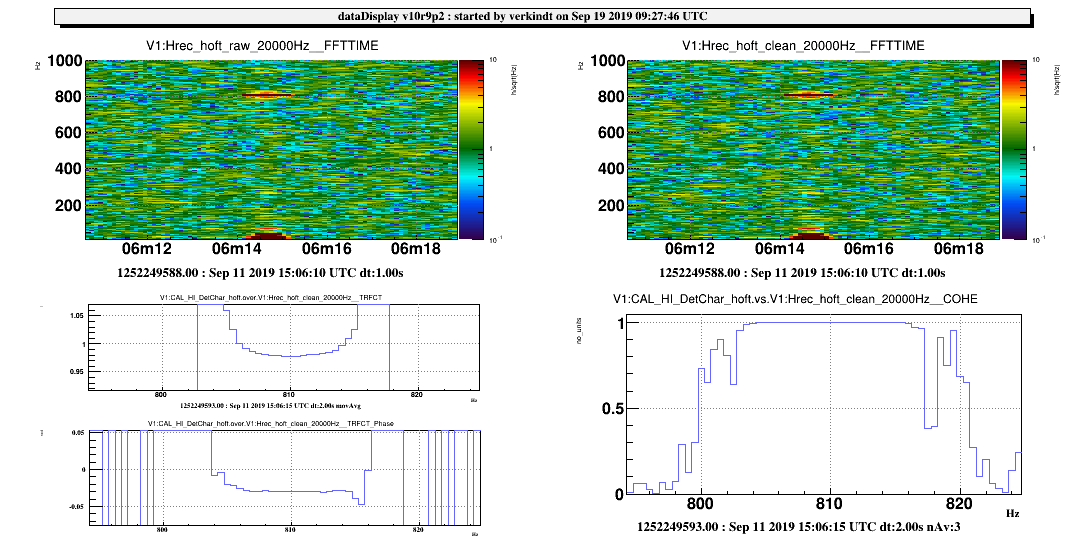
15:05:10 UTC : f=811 Hz : SNR=40,80,160,320,640,1280,2560
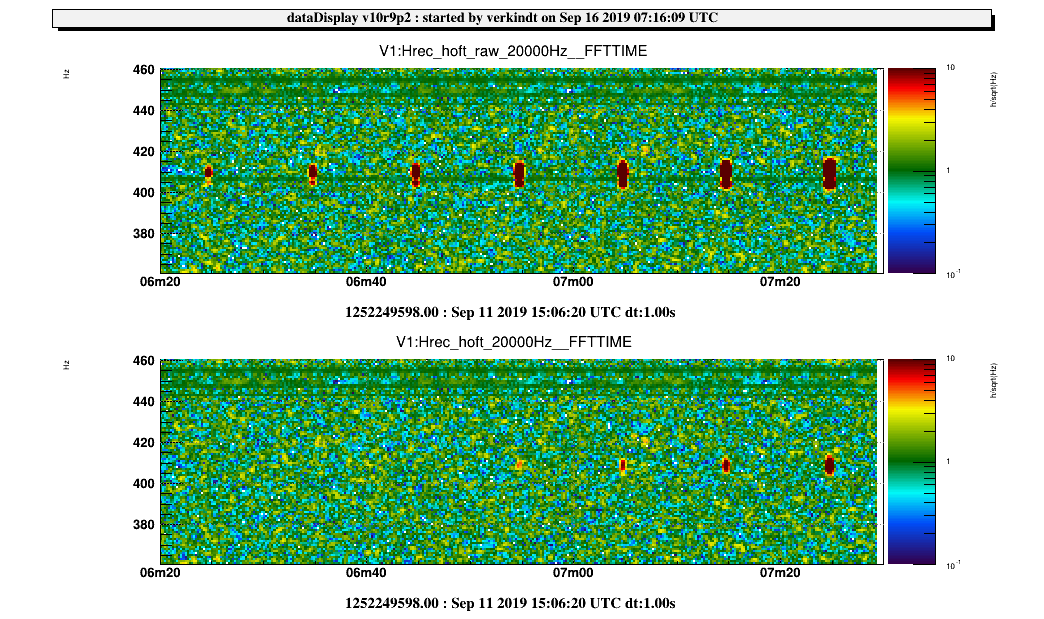
15:06:20 UTC : f=409 Hz : SNR=40,80,160,320,640,1280,2560
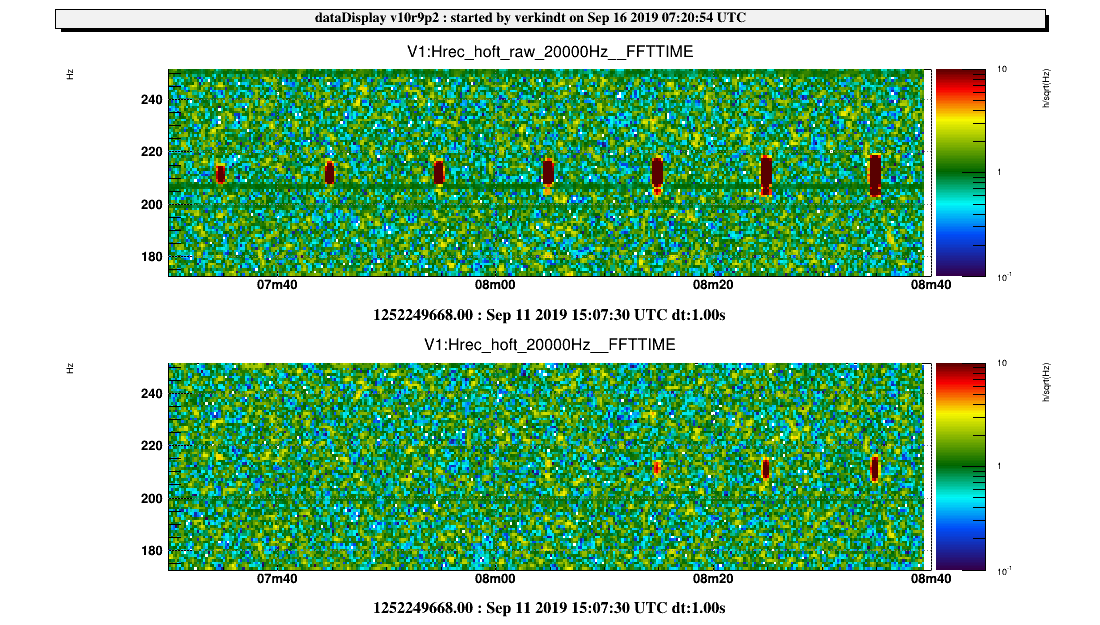
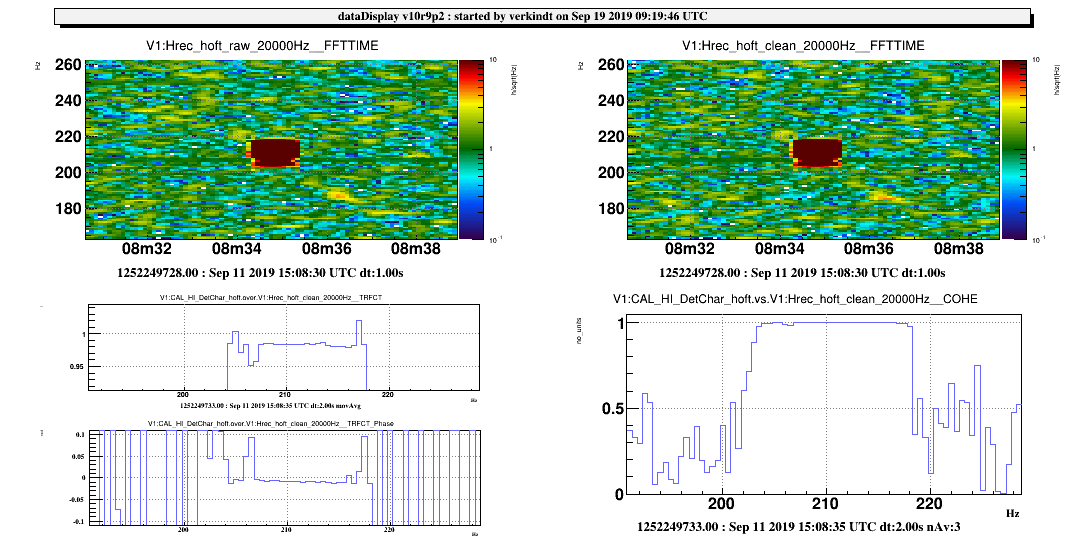
15:07:30 UTC : f=211 Hz : SNR=40,80,160,320,640,1280,2560
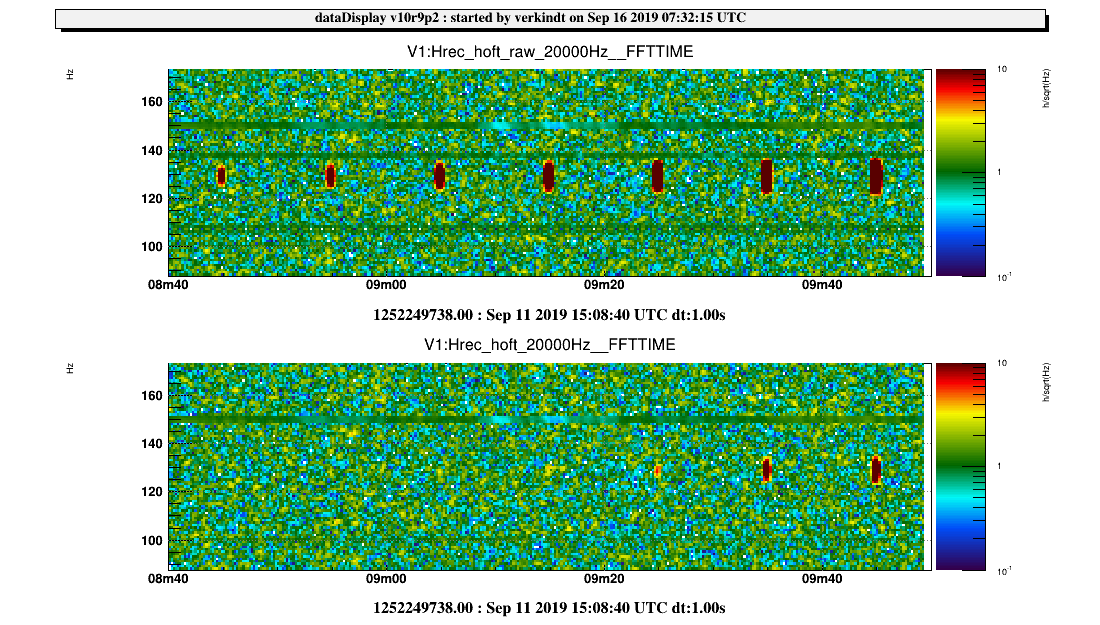
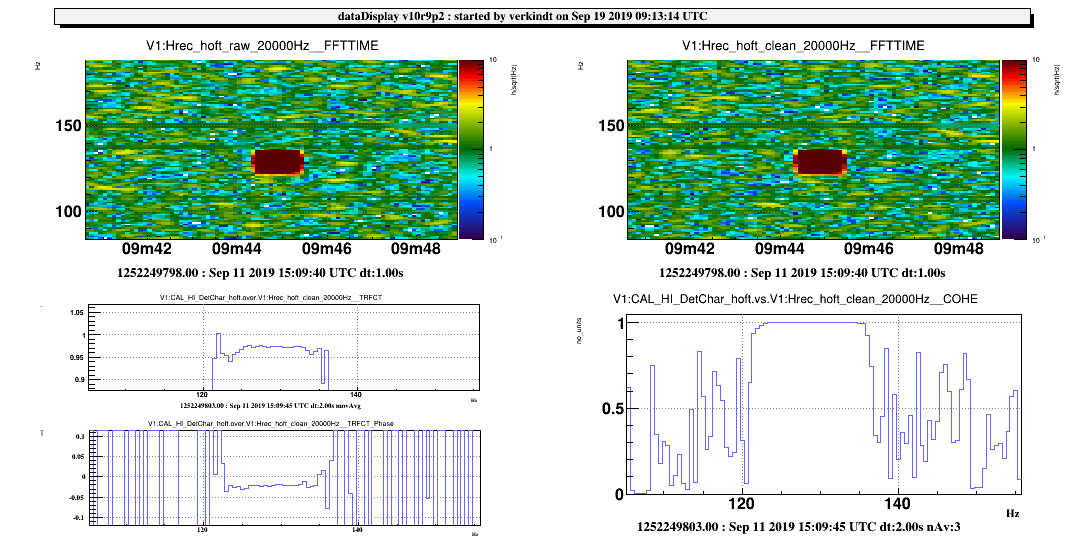
15:08:40 UTC : f=129 Hz : SNR=40,80,160,320,640,1280,2560
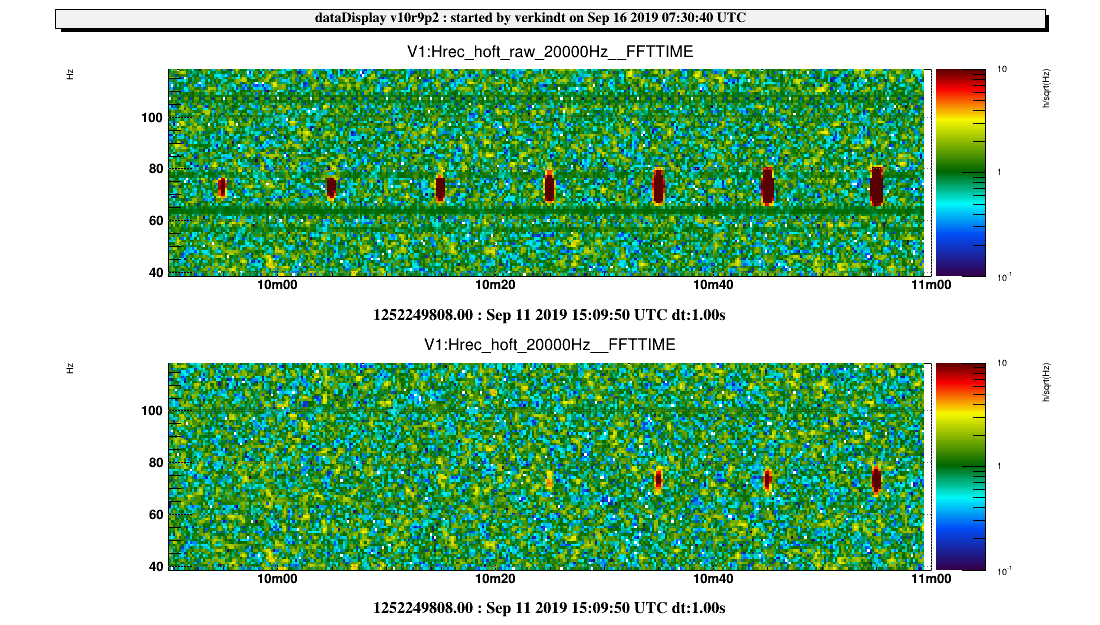
15:09:50 UTC : f=73 Hz : SNR=40,80,160,320,640,1280,2560
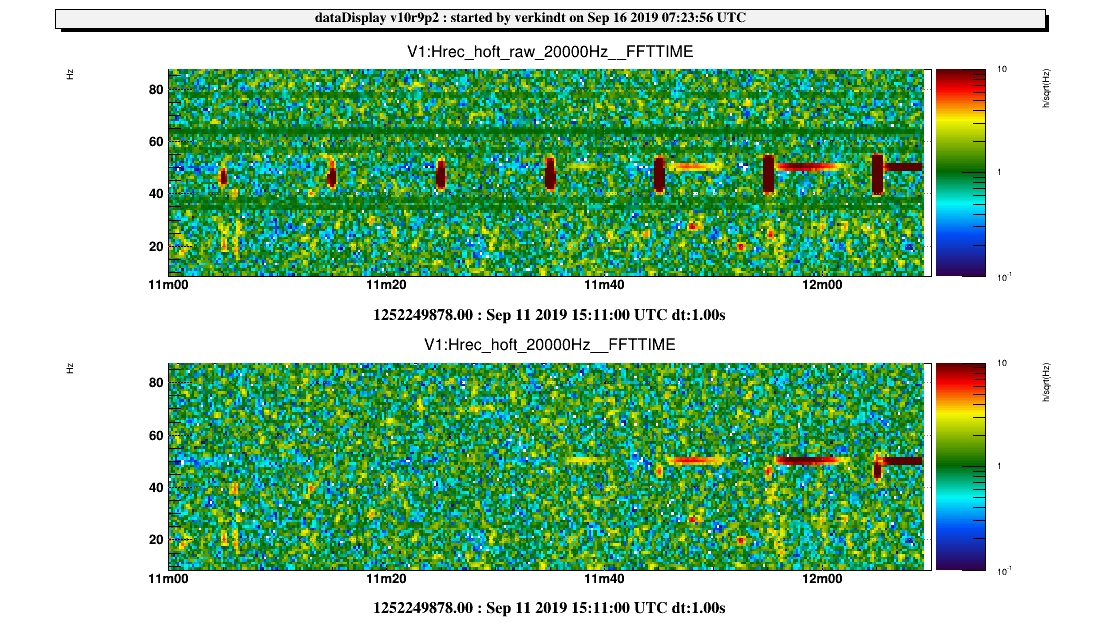
15:11:00 UTC : f=47 Hz : SNR=40,80,160,320,640,1280,2560
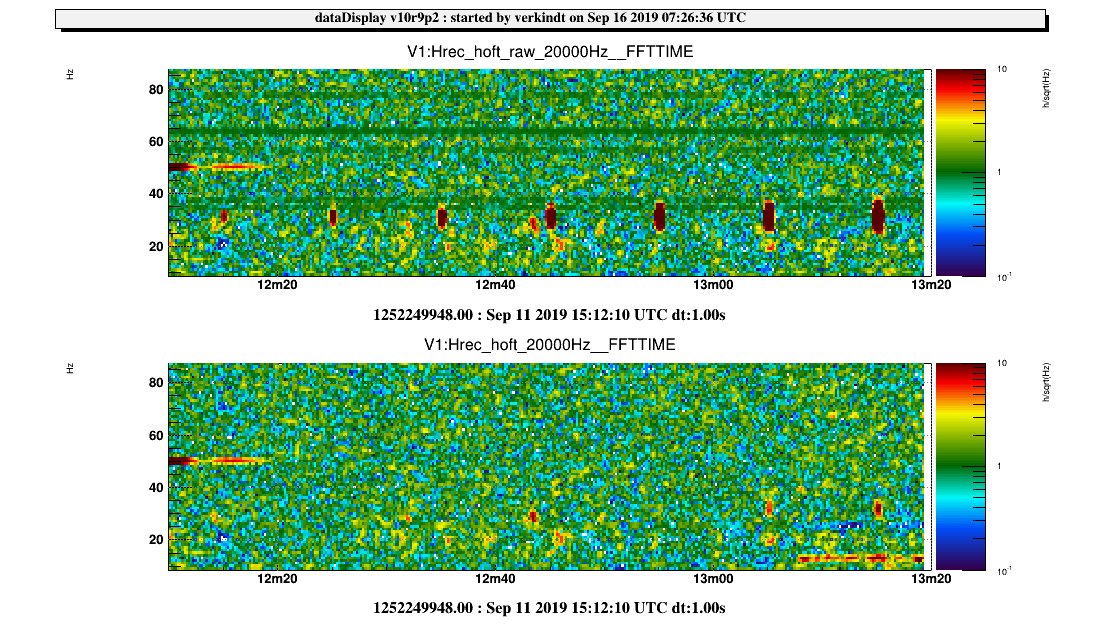
15:12:10 UTC : f=31 Hz : SNR=40,80,160,320,640,1280,2560
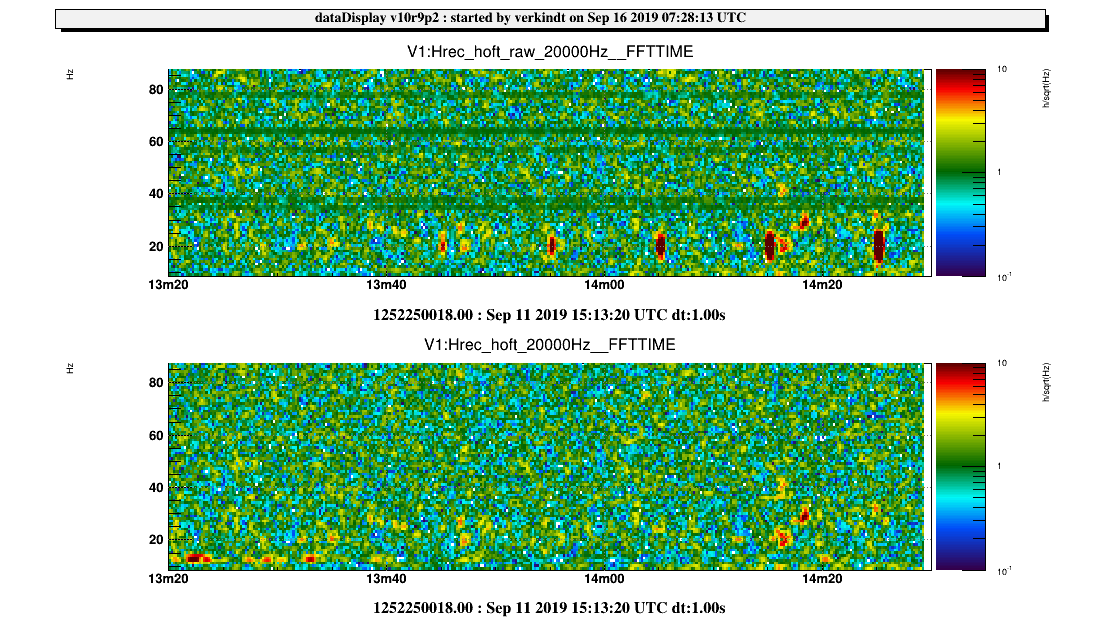
15:13:20 UTC : f=19 Hz : SNR=40,80,160,320,640,1280,2560
For instance, f=19 Hz SNR=160 had maximum amplitude at 15:13:45 UTC, in the middle of the 10s window 15:13:40 - 15:13:50.

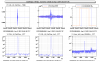
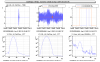
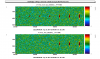
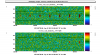
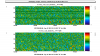
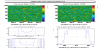
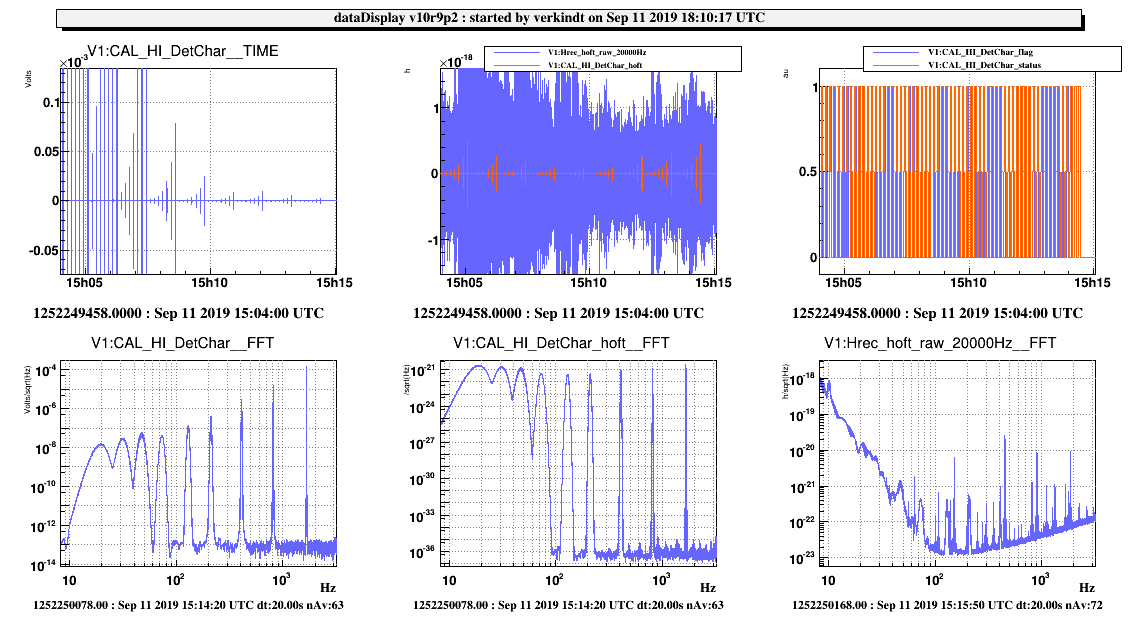
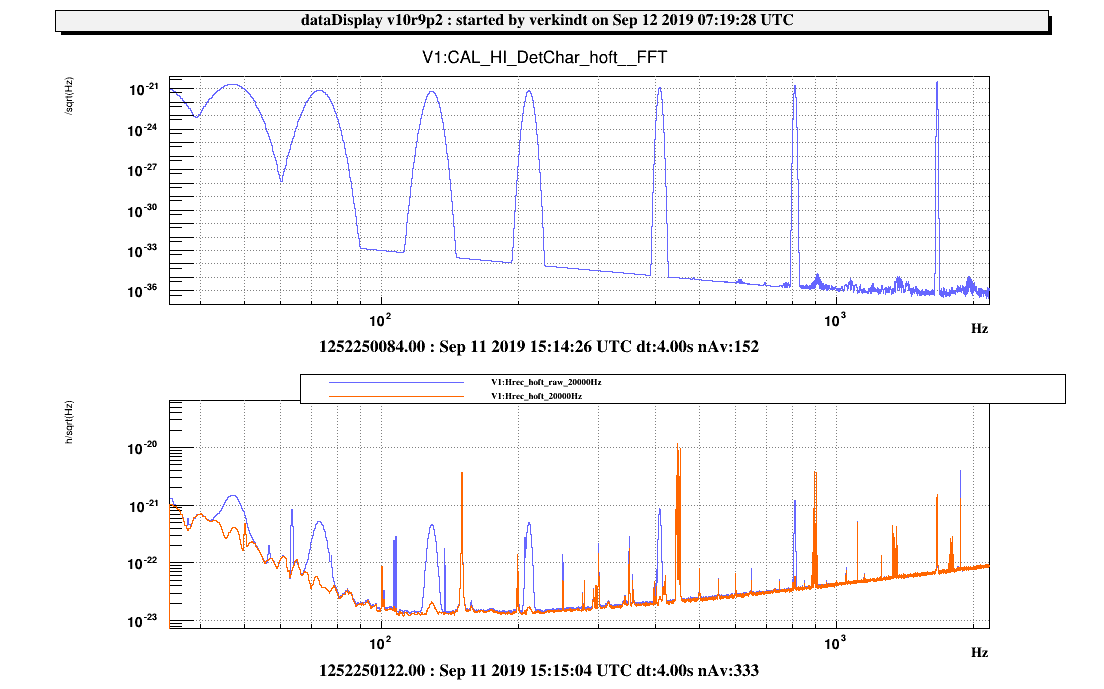
Plot1 shows the full set of injections seen in the concerned channels and in Hrec_hoft_raw_20000Hz and the spectrum of those channels.
CAL_HI_DetChar is the injected signal (in volts) at the level of the NE DAC.
CAL_HI_Detchar_hoft is the original injected signal read in the HI input file of Nicolas.
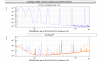
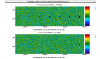
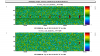
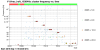
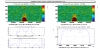
Plot2 shows oonly the injection at f=1667 Hz and SNR=160
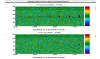
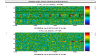
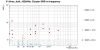
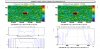
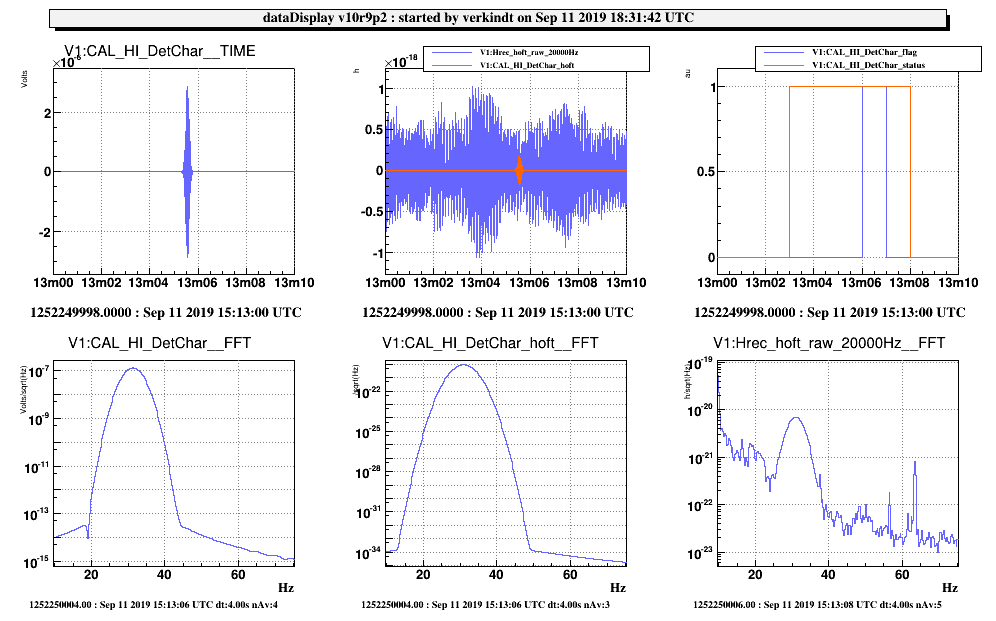
Plot3 shows only the injection at f=31 Hz and SNR=640

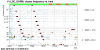
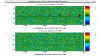
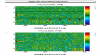
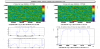
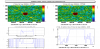
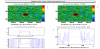
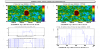
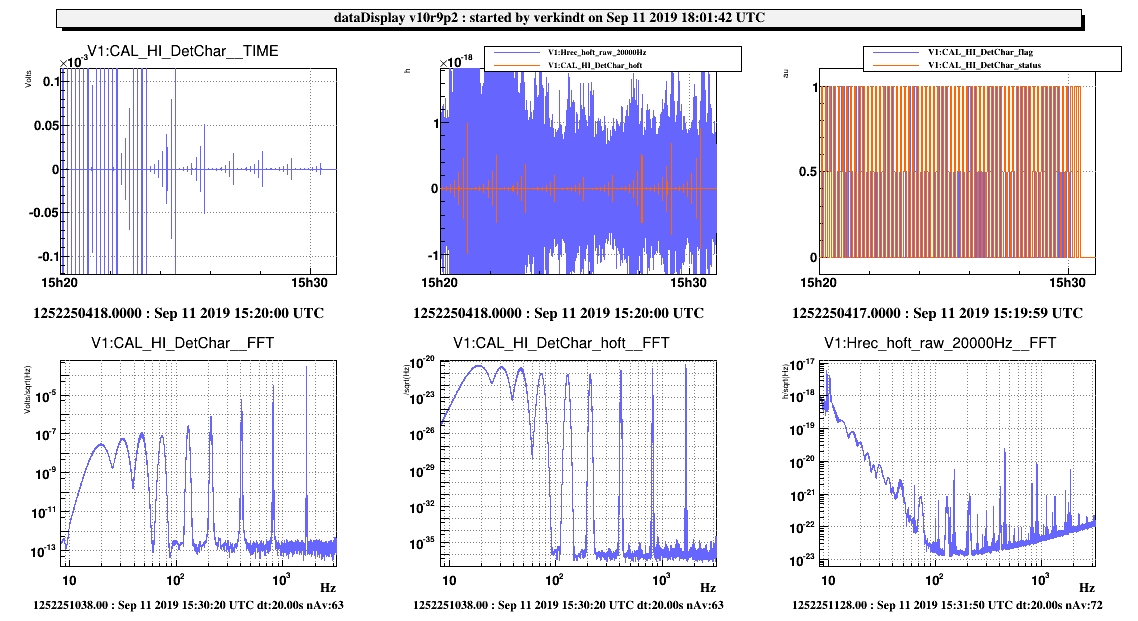
Trying to solve the wrong time position of the flag CAL_HI_DetChar_flag, I have done a second set of injections at 15:20 UTC, but with all the SNR values doubled (just to have a different set).
The flag problem was not solved but this second set  (shown on Plot4) is also available for veto safety studies.


Images attached to this report
Comments to this report:
verkindt - 9:49 Thursday 12 September 2019 (46903) Print this report

Some additional information about the hardware injections and their removal in h(t) and how they have been seen by Omicron.
Plot1 shows the average spectrum over all the injections of 15h04 UTC, for the injected signal (upper plot) and for Hrec_hoft_raw_20000Hz (lower plot, blue) and Hrec_hoft_20000Hz (lower plot, orange). We see in Hrec_hoft_20000Hz small residual of the injections.
Plot2 and Plot3 show how this residual is detected by Omicron.
Plot2 shows Omicron triggers in LSC_DARM in time-frequency plane, where can be seen the injections of 15h04 and of 15h20, as high SNR Omicron triggers.
Plot3 shows Omicron triggers in Hrec_hoft_20000Hz where some injections are still visible as high SNR triggers, and where some injections (for instance at 1667 Hz and 811 Hz) are less detected.

Images attached to this comment
verkindt - 11:45 Monday 16 September 2019 (46928) Print this report

I had an other look at the detchar HI done on Sept 11.
Plots 1 to 9 show the normalized spectrograms of Hrec_hoft_raw_20000Hz and Hrec_hoft_20000Hz, for the detchar Hardware Injections done between 15:04 and 15:14 UTC on 2019-09-11,
at 1667Hz, 811 Hz, 407 Hz, 211 Hz, 129 Hz, 73 Hz, 47 Hz, 31 Hz and 19 Hz.
We can observe that the injected glitch is well removed in h(t) as long as its SNR is below 150.
For the injections at 47 Hz,  when the SNR>300, some excitation is visible around 50 Hz in the few seconds that follow the injection (to be investigated).
We can observe also that the 31 Hz and 19 Hz glitches are almost fully removed from h(t).

Plot 10 shows the Omicron triggers in time-frequency plane.
We can observe that the injections done at 1667Hz, 811Hz, 31Hz and 19 Hz, are not seen by Omicron in h(t). Any hint about this is welcome...
We can observe also that the excitation around 50 Hz is seen by Omicron which thus put the triggers around 50 Hz instead of the 47 Hz of the injected glitches.

Plots 11 and 12 show the SNR of the Omicron triggers versus frequency and versus time. Those SNR are to be compared to the injected SNRs. The reduction of about 40-50 due to the injection removal in h(t) is observed but with large fluctuations depending on the frequency of the injected glitch. A more detailed quantitative study of the SNRs still needs to be done.

Images attached to this comment
robinet - 9:35 Tuesday 17 September 2019 (46937) Print this report

Omicron is able to scan a long time segment: omicron [gps start] [gps stop] [parameters.txt]. To get a continuous plotting, the plot time window must be adjusted to match the analysis time window.

I used this feature to scan the entire period of hardware injections (h(t) only and f < 500 Hz): https://scientists.virgo-gw.eu/DataAnalysis/Omicron/robinet/o3/HI/Sept11

  • injections above 500 Hz are not detected (by construction!)
  • Loud injections at high frequency seem to also impact the low-frequency region
  • injections are well visible in V1:Hrec_hoft_raw_20000Hz. However, the SNR values announced in your logbook entry are over-estimated by some factor.
  • As mentionned in the previous post, only residuals are visible in V1:Hrec_hoft_16384Hz
verkindt - 14:12 Thursday 19 September 2019 (46966) Print this report

One possible explanation of why Omicron did not trigger on the HI done at 1667 Hz and 811 Hz in the set of detchar HI of 2019-09-11-15:04 UTC is that loud low-frequency noise was generated during the injections, as can be seen on plots 1 and 2. And Omicron triggered on this noise. Plot 3 shows a zoom on this noise.
In all these plots, upper row shows the spectrograms of Hrec_hoft_raw_20000Hz (no noise+calib lines+HI subtraction) and Hrec_hoft_clean_20000Hz (only noise+calib lines subtracted) and the lower row shows the TF and Coherence plots between the injected signal (CAL_HI_DetChar_hoft) and Hrec_hoft_clean_20000Hz, iin the frequency band of the injected sine-gaussian signal.
The low frequency noise is not present for the other injections at 407, 211, 129, 73, 47 and 31 Hz. We will investigate the origin of it in the case of 1667 and 811 Hz injections.

For completeness, plots 4,5,6,7 show the same information for the injections at 407, 211, 129 and 31 Hz, where the TF module is around 1 and the TF phase is around 0, as expected.

Images attached to this comment
Search Help
×

Warning

×