Reports 1-1 of 1 Clear search Modify search
Environmental Monitoring (Environmental Monitoring)
fiori, genin, pillant - 12:30 Monday 10 July 2017 (38510) Print this report
Accelerometer on EIB

This morning we moved on EIB  the PCB mod 393B12 accelerometer which was on EAB. The accelerometer is named ENV_EIB:ACC:Z,it is oriented horizontally along the IMC axis direction.

At some frequencies above 100Hz the accelerometer dominated by intrisic noise, which according to spec is at 1E-6 m/s2/sqrtHz.

Comments to this report:
bertolin - 14:50 Monday 10 July 2017 (38515) Print this report
Comparison between EIB_ACC_Z and EIB_SEIS_Z measuring the motion of a quiet EIB. The difference is remarkable above 100 Hz.
Nevertheless the sensor is still not good enough to make a reliable projection. Perhaps we should attempt using a 731-207 accelerometer which has 3 times lower noise
than the PCB being used now.
Images attached to this comment
genin, derossi, pillant, fiori - 22:32 Monday 10 July 2017 (38530) Print this report
This morning, we have injected again some seismic noise on the EIB after installing the accelerometer.
White noise: amplitude=0.02
Start time GPS: 1183722865 (+300s)

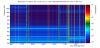
As expected the noise injected can be seen also on the other horizontal direction and vertically too.

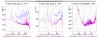
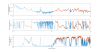
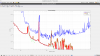
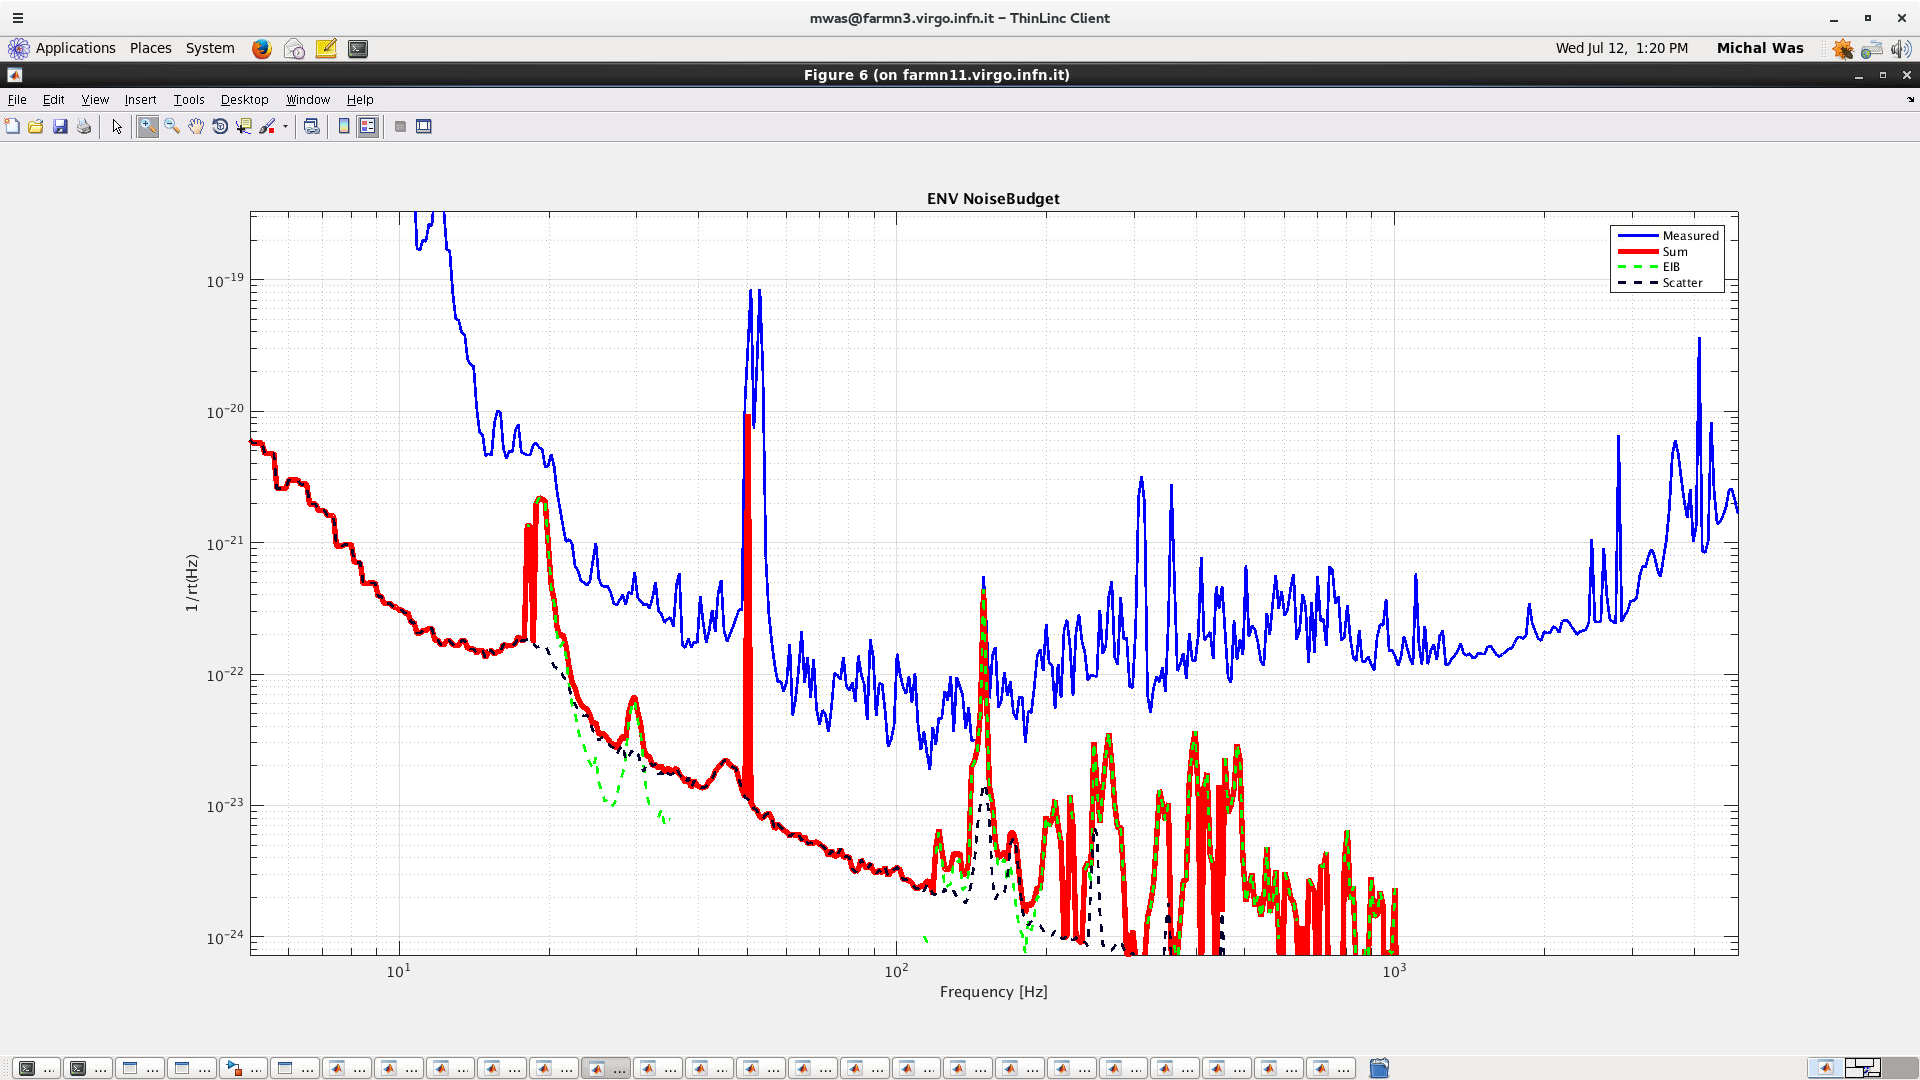
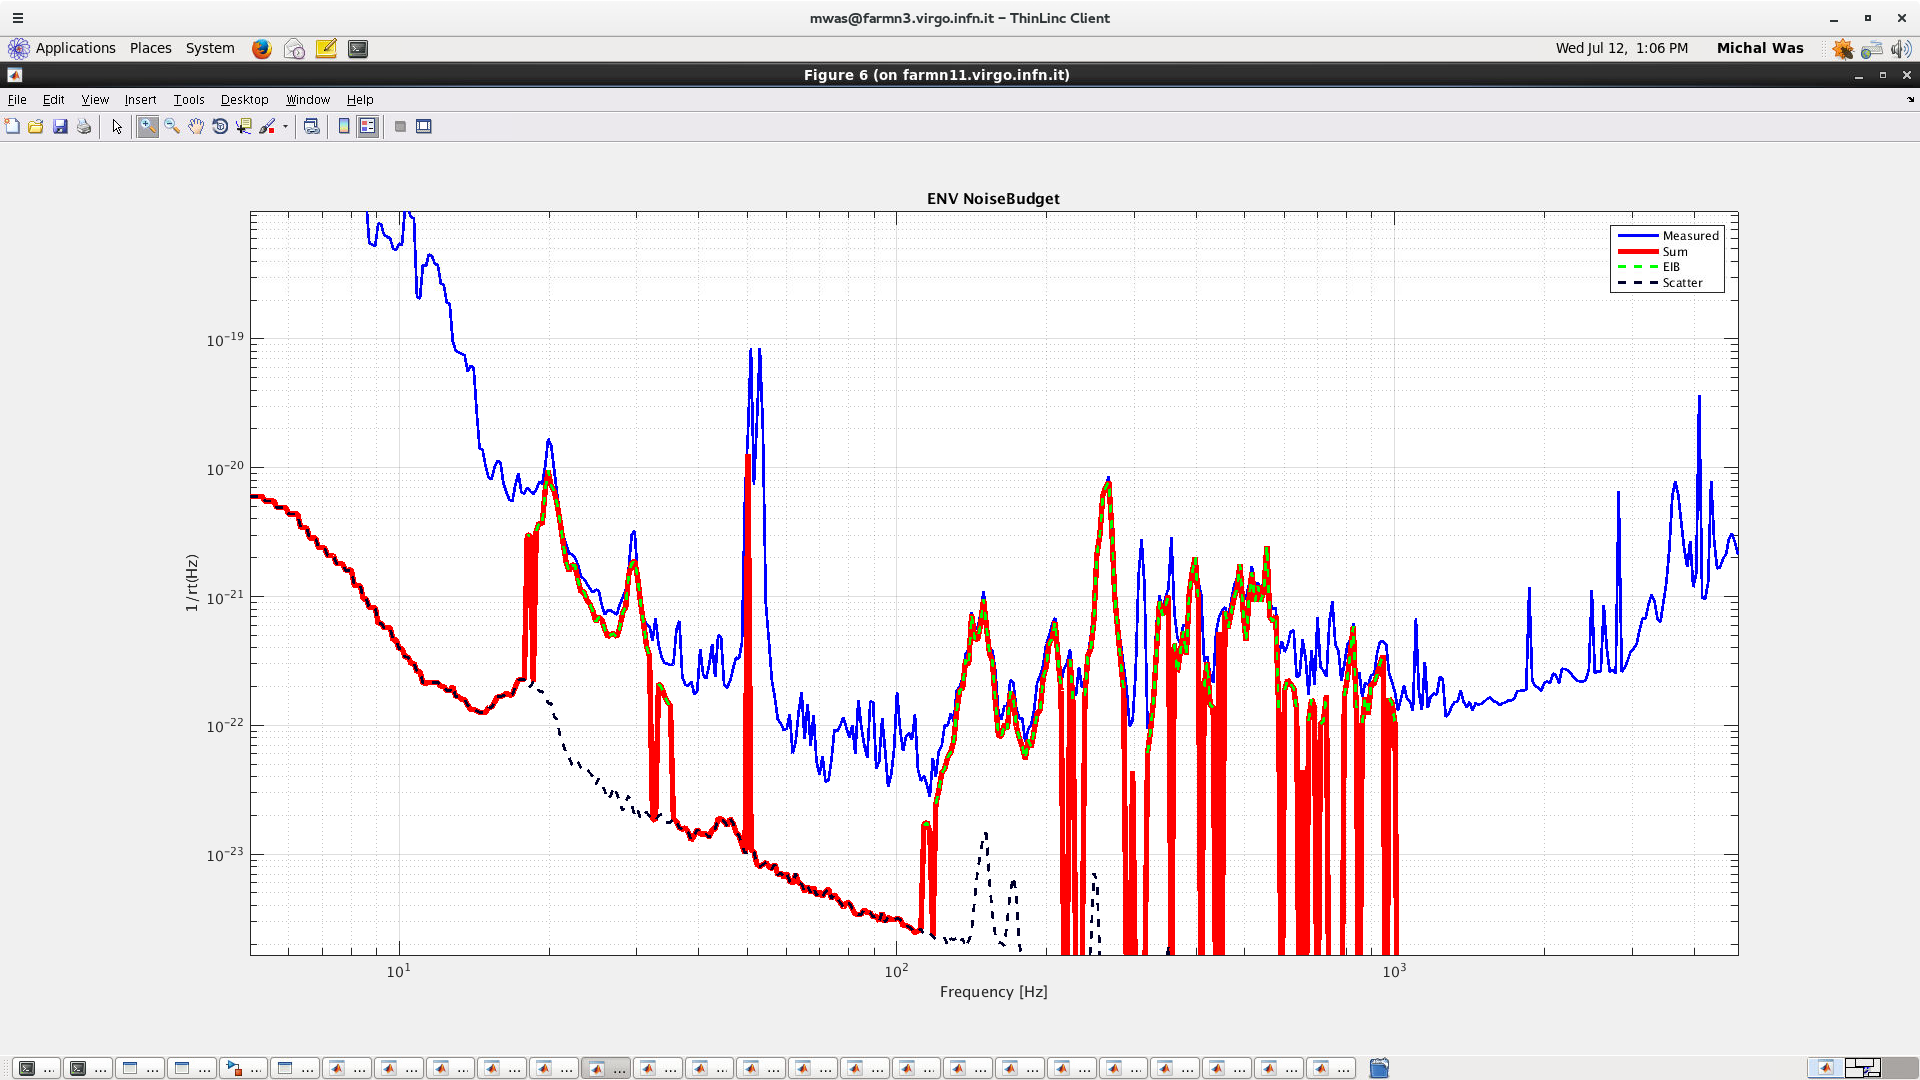
On the first plot, we can see that there is a good coherence between DARM and seismic sensors around 20Hz and between 100Hz and 1kHz.

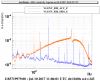
There is also a good coherence with the microphone located on the EIB. Note that the injection was quite strong since you could hear very well

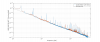
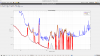
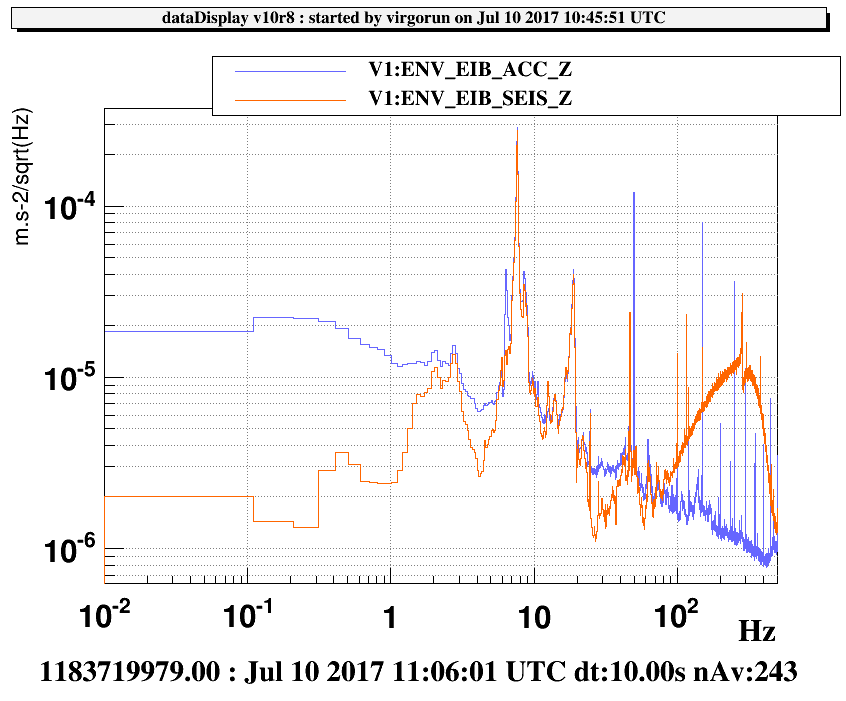
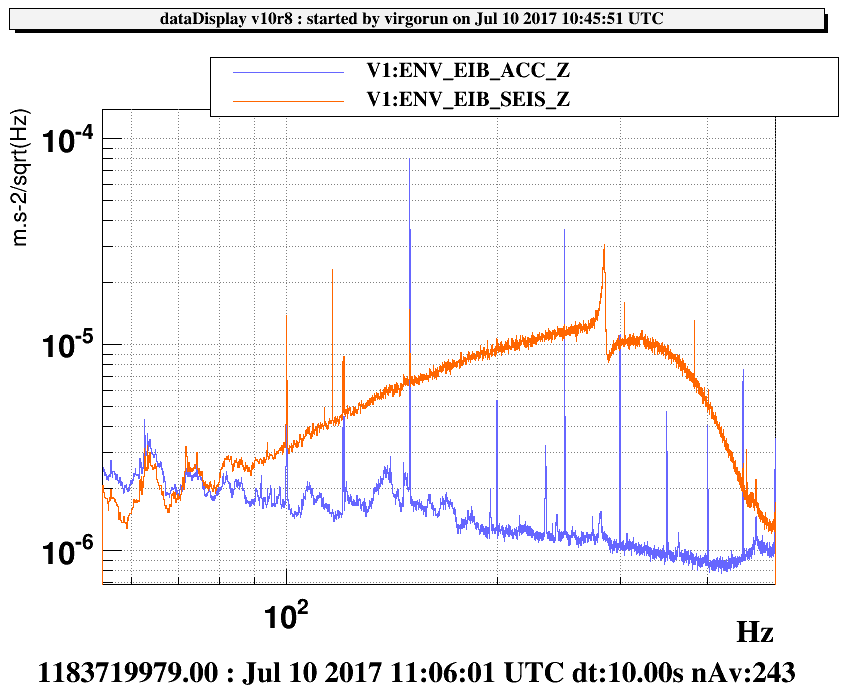
the noise produced by the shaker when we tested it in the laser lab (the second plot shows a comparison of the episensor and the accelerometer with and without the noise on).

The first pdf file shows a zoom of the 100Hz-1kHz region. There is a good coherence also between DARM and SSFS_CORR.

For sure, shaking the EIB, we generate beam jitter and also frequency noise since the EIB is part of the IMC frequency stabilization loop since

it hosts the IMC locking photodiode.

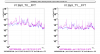
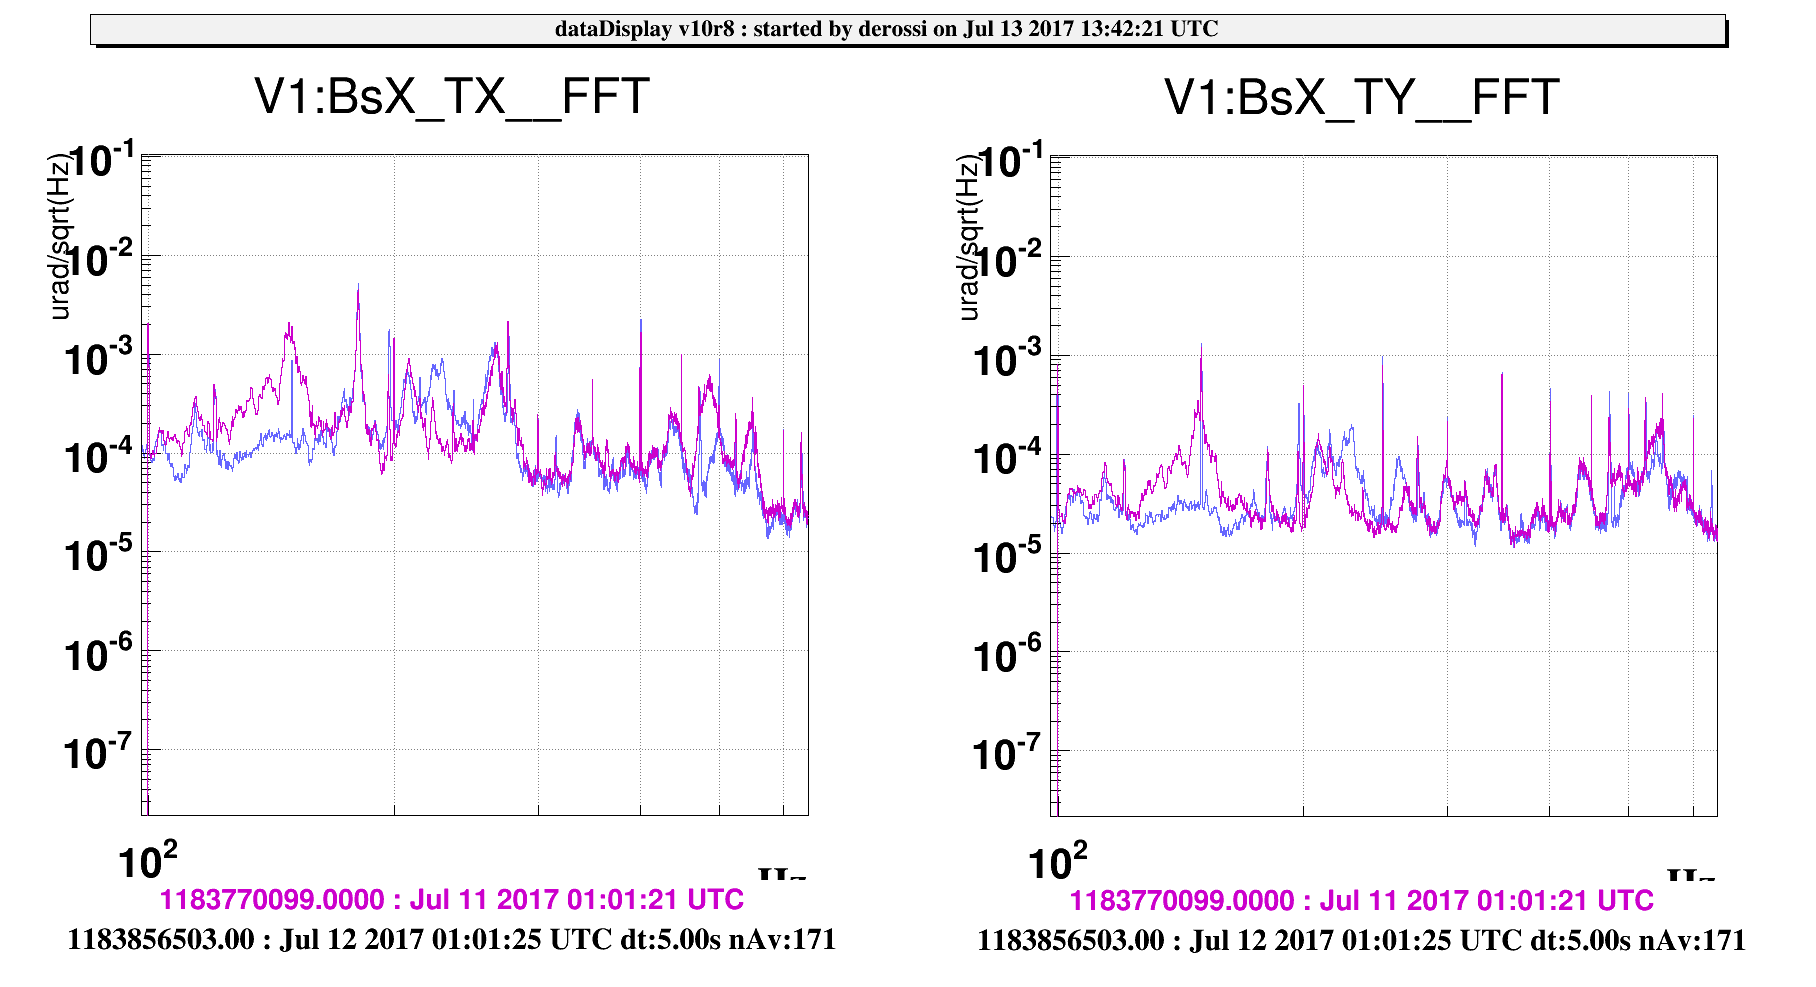
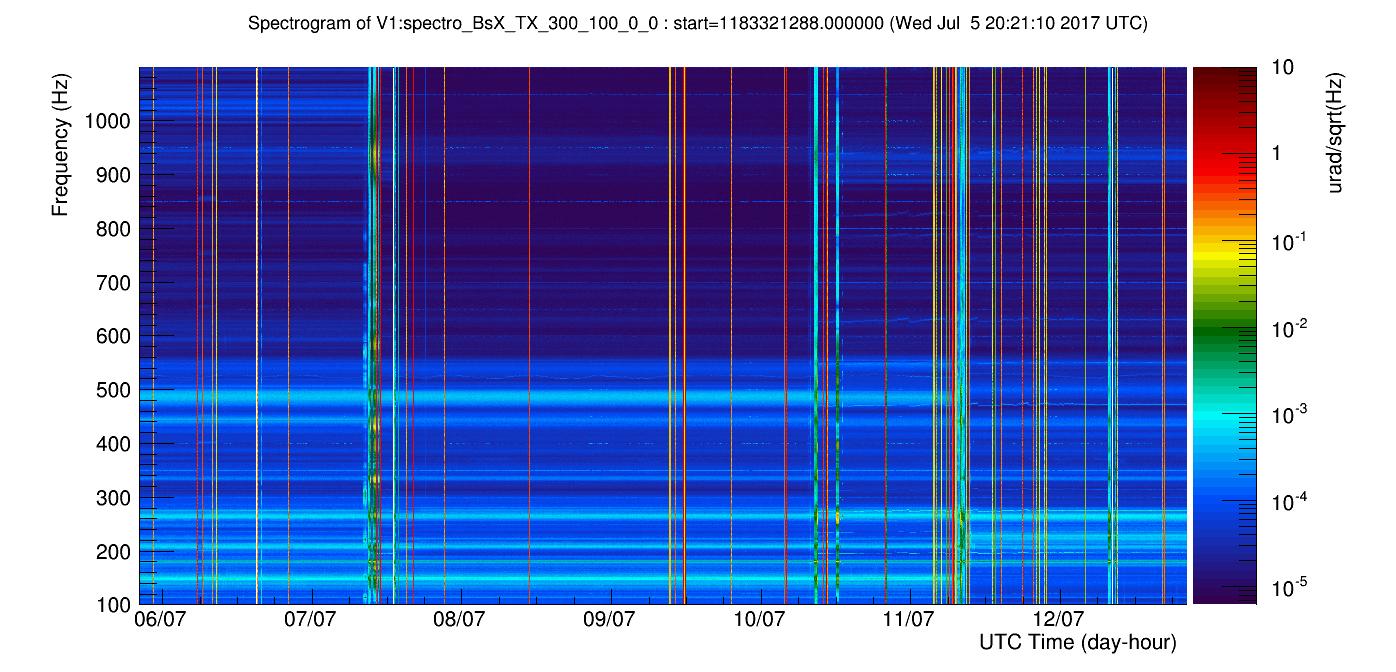
Looking at the BPC signals one can see that a lot of structures are excited by the shaker (second pdf file). Those structures are probably associated to the mirror mounts on the laser beam path.

We plan to perform some tapping tests to associate each peak to a mount for a better understanding of the situation. Those peaks are normal. It was already seen in Virgo and Virgo+

and also during the tests we performed on the BPC in the EGO optics lab. We can see part of those lines with the BPC even when everything is quiet because the quadrant setup (in particular teh far field ones) can sense very small tilts.

We know also that those mechanical resonances can be excited by the seismic and/or acoustic noise.

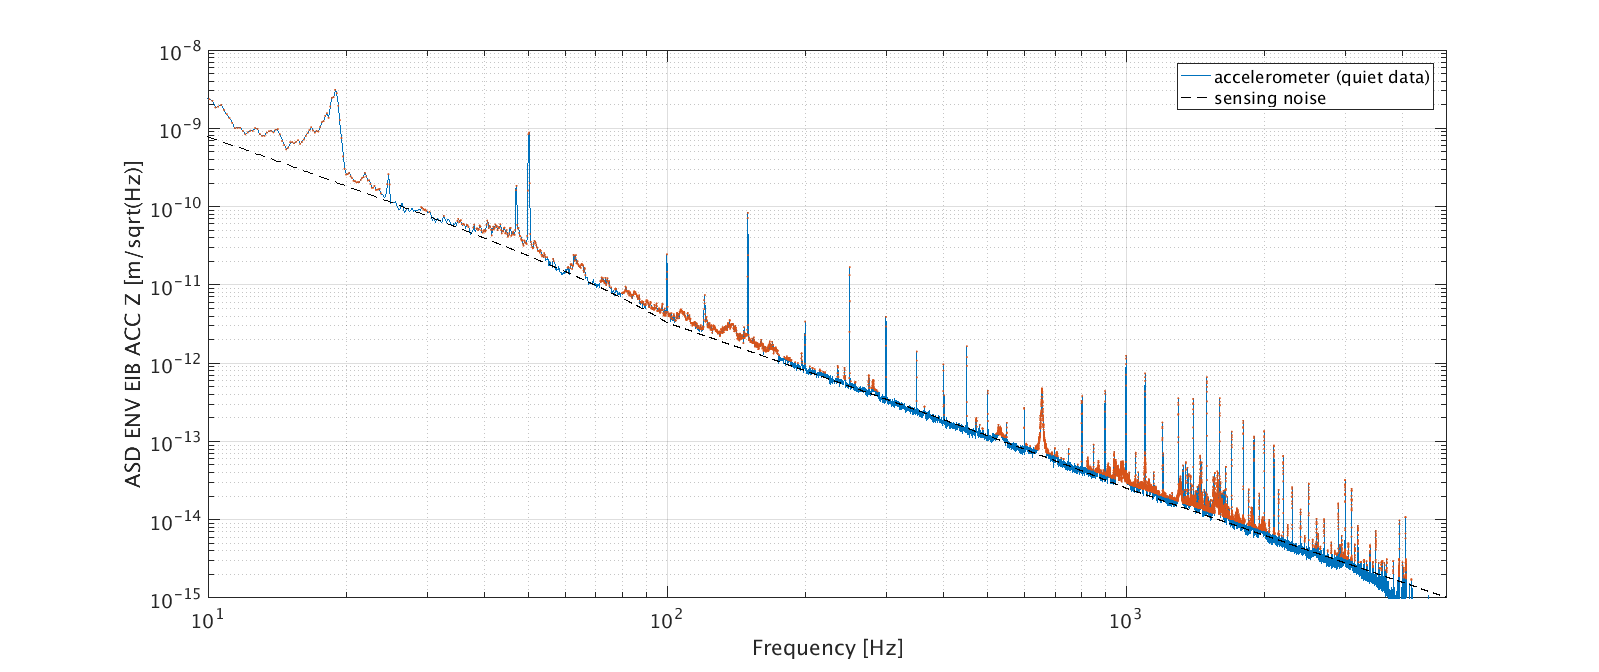
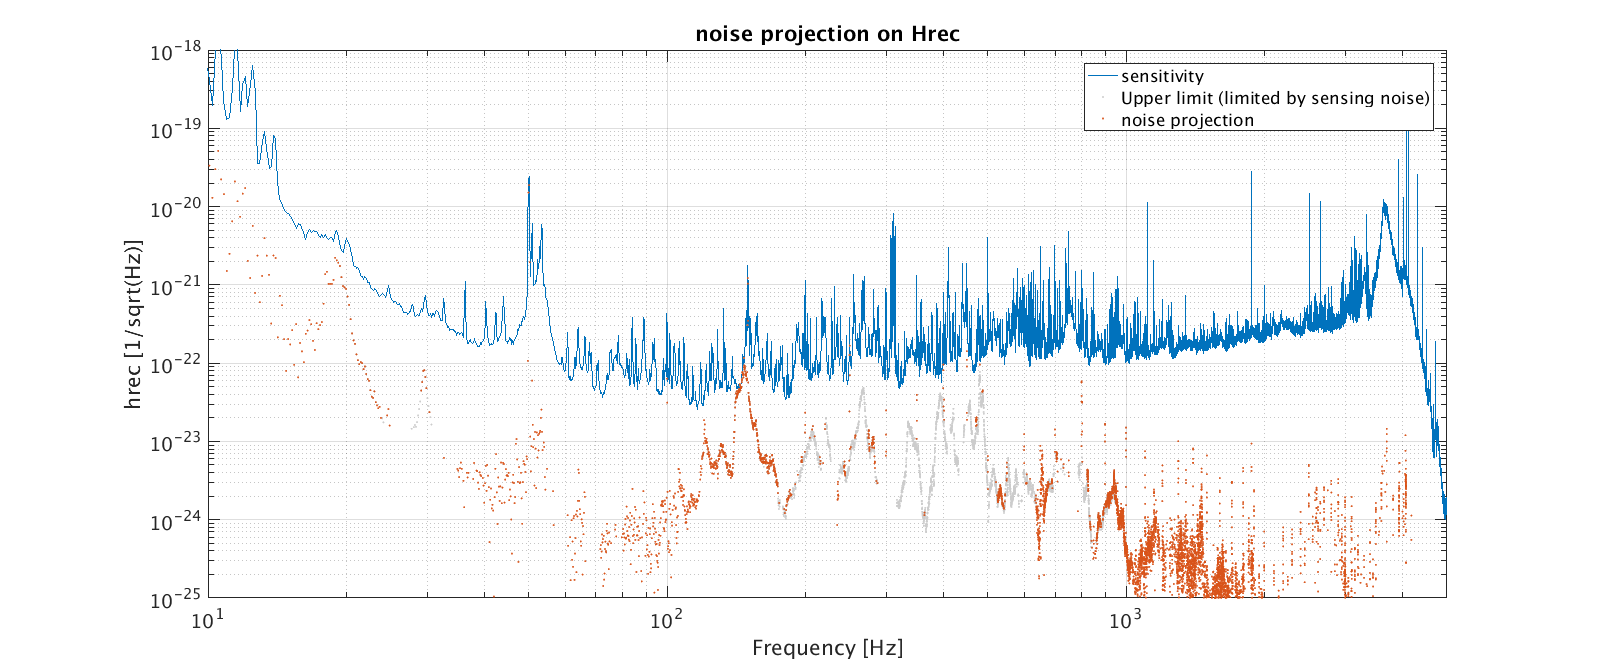
As pointed out by Alessandro, the accelerometer sensing noise is limiting the noise measurement in quiet conditions but it should give us an upper limit of the noise projection at least.

We will post noise projections tomorrow.


PS: a sweep line has also been injected. More details will be posted in the logbook tomorrow.

Images attached to this comment
Non-image files attached to this comment
pillant, genin, fiori - 11:23 Wednesday 12 July 2017 (38571) Print this report

We have replaced the PCB accelerometer by a Meggit one which is expected to be more sensitive up to 1000Hz.

We see the improvement on the attached plot (purple: meggit, blue: PCB).

On the second plot, one can see that the new accelerometer has a higher noise at frequencies above 1 kHz.

NB: the model installed is a MEGGIT mod. 731-207.\

Note also that the structure which could be seen on the 2 accelerometers (around 650Hz see third plot) is likely due to the accelerometer support which enables us to put it horizontal.

Images attached to this comment
derossi, pillant, fiori, mantovani, genin - 12:04 Wednesday 12 July 2017 (38539) Print this report

Here we report the noise projection of the accelerometer signal on Hrec.

The first plot shows the transfer function (magnitude and phase) and coherence between the accelerometer and Hrec .

The second plot shows the spectrum of the accelerometer in a quiet period and the sensing noise curve. In red are shown the points above the sensing noise. The peak at 650 Hz is the resonance of the accelometer mounting (PCB 393b12 model), and in the high frequency the peaks of the harmonics of the 50 Hz are dominant.

The third plot shows the noise projection on Hrec, computed by taking into account only points with coherence greater than 0.5 (in red on plot 1). The points in grey are an upper limit (corresponding to the data limited by the accelerometer sensing noise). We are close to be limited around 20 Hz and around 150 Hz. This second peak has been identified yesterday as the resonance of the mirror EIB M9. We better clamped this mirror and the resonance shifted to higher frequencies. However, to better estimate the effect of this actionon the projection we need to perform another injection as soon as possible.

Images attached to this comment
mwas - 13:25 Wednesday 12 July 2017 (38574) Print this report
I have added the noise projection to the noise budget using the noise injection time, and making a transfer function whenever the coherence is above 0.2.

Figure 2, the noise budget of environmental noise during the noise injection. Projection matches relatively well
Figure 1, same during a quiet time Monday night, note that the projection at 50Hz and 150Hz is not that meaningful as the mains are coherent on all the signals, but the shoulder left of the 150Hz peak is meaningful (the identified mirror on EIB).
Also, here there is no distinction to highlight when the projection is a real measurement and when it is an upper limit limited by sensing noise of the accelerometer at quiet times.
Images attached to this comment
bertolin - 14:07 Wednesday 12 July 2017 (38575) Print this report
I suggest to check the signal from EIB_SEIS_X for the low frequency (~20Hz) bump; i think it transfer even more to DARM and Hrec.
Actually it seems Z to have the weakest coupling compare to X and Y; i would put the piezo-accelerometer oriented along X before doing a new injection.
derossi, pillant, genin - 15:24 Thursday 13 July 2017 (38602) Print this report

The 1st plot shows the spectra of the BPC angular degrees of freedom, TX and TY, before and after the clamping of the M9 mirror. It can be seen that we moved the frequency of the peak at 150 Hz to 220 Hz and that the peak at 490 Hz has been reduced on TX.

This is also visible on the spectrogram of TX taken from the VIM (plot 2).

By the way we should plan the substitution of the mount in order to move further the resonance.

Images attached to this comment
mantovani, soldani - 18:15 Thursday 13 July 2017 (38607) Print this report

In order to check if the bump was due to the mount we have switched off the INJ LAB air conditioning (completely) for 10 minutes starting from 13:21 UTC.

As it is visible in figure 1, purple AC on black AC off,  the sensitivity has been improved @ 220 Hz and the coherence with the BPC error signals is reduced (especially with the vertical ones)

Images attached to this comment
derossi - 16:14 Thursday 19 April 2018 (41150) Print this report

I made a mistake. It was M8 mirror.

Search Help
×

Warning

×