This afternoon, we injected a low frequency line (0.1Hz) on the suspended benches (SDB1, SDB2, SNEB, SWEB, SPRB) in order to have a new measurement of the scattered light coupling factors. Each time the line was injected through the top stage of the suspension, and along the longitudinal degree of freedom (Z coordinate of the bench).
Below is the list of collected data:
- From 15h00 to 15h17 utc, nothing was done on the interferometer. These data can be used as reference (the B5 PD1 photodiode had its shutter closed during this period).
- SDB1 injections (the B5 PD1 photodiode had its shutter closed during these injections):
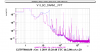
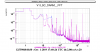
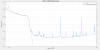
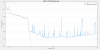
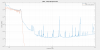
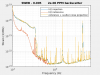
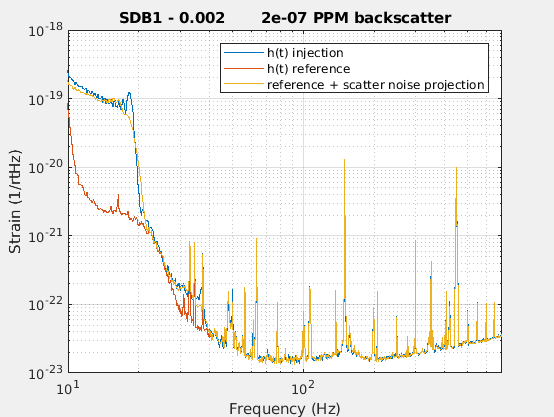
- From 15h18m00 to 15h23m00 utc, line amplitude corresponds to a motion of +/-17 um for the bench. The DARM spectrum during the injection is compared to the reference sensitivity in Fig.1
- At 15h23m37 utc we opened the tracking control of SDB2, while keeping the same level of injection on SDB1 for 3 min (+/-17 um).
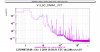
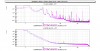
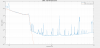
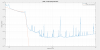
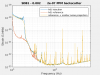
- From 15h27m00 to 15h30m20 utc, line amplitude corresponds to a motion of +/-20 um for the bench (SDB2 tracking still open). See Fig.2
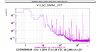
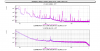
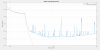
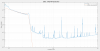
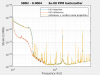
- From 15h30m40 to 15h34m40 utc, line amplitude corresponds to a motion of +/-14 um for the bench (SDB2 tracking still open). See Fig.3
- At 15h34m50 utc we closed the tracking control of SDB2, while keeping the same level of injection on SDB1 until 15h38m32 utc.
-
Taking another reference time without injections: 15h39m00 – 15h42m00 utc
-
At 15h42m14 utc the shutter of the B5 PD1 photodiode was opened. We then took another 3 min of reference data without injections (15h42m20-15h45m40 utc).
-
At 15h45m43 utc, the SDB2 tracking loop was open again. Taking another period of reference data (15h45m50 - 15h51m10 utc).
-
SDB2 injections:
-
From 15h54m10 to 15h57m00 utc, line amplitude corresponds to a motion of +/-6 um for the bench.
-
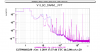
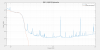
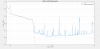
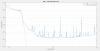
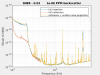
From 15h57m05 to 16h01m00 utc, line amplitude corresponds to a motion of +/-12 um for the bench. See Fig.4
-
From 16h01m10 to 16h05m40 utc, line amplitude corresponds to a motion of +/-18 um for the bench. See Fig.5
-
Taking 2 min of data without injections (16h06m00 - 16h08m20 utc) and SDB2 tracking loop still open.
-
-
At 16h08m21 utc, the SDB2 tracking loop was closed.
-
Opening SNEB SBE tracking loop at 16h14m01 utc.
-
At 16h22m30 utc : we started to inject the line on SNEB, but the interferometer unlocked (probably because an unwanted broad band noise was incidentally injected at the same time). The SNEB SBE tracking loop was then closed back.
-
ITF back in Low noise 3 SQZ at 16h51 utc. Taking 8 min of quiet reference data.
-
SNEB injections:
-
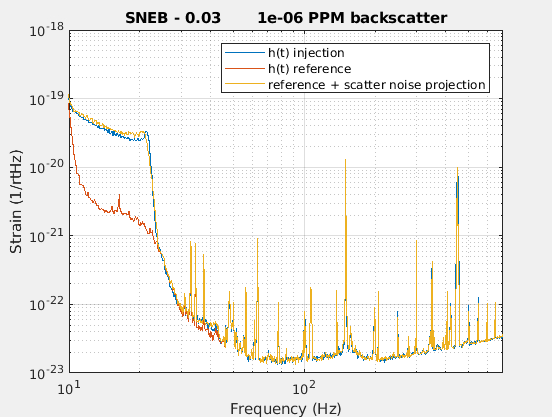
Injecting line at 17h09m30 utc with amp = 30, SNEB moving by +/-9 um, see Fig.6
-
Injecting line at 17h12m17 utc (4min) with amp = 60, SNEB moving by +/-18 um, see Fig.7
-
Injecting line at 17h16m38 utc (3min30) with amp = 80, SNEB moving by +/-24 um, see Fig.8
-
-
Reference quiet time: 17h21m00 - 17h25m00 utc
-
SWEB injections:
-
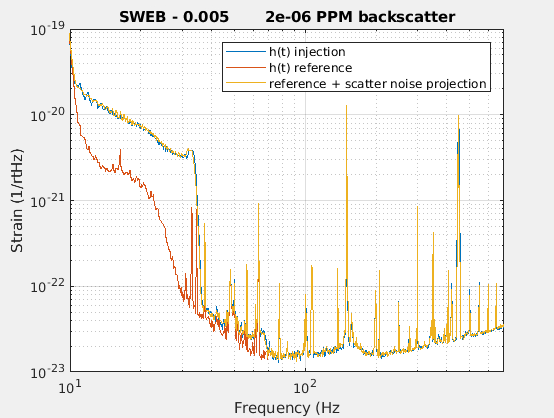
Injecting line at 17h30m30 utc with amp = 100, SWEB moving by +/-13 um
-
Injecting line at 17h35m30 utc with amp = 150, SWEB moving by +/-20 um, see Fig.9
-
Injecting line at 17h39m10 utc with amp = 190, SWEB moving by +/-27 um, see Fig.10
-
Injection stopped at 17h43m50 utc
-
-
Reference quiet time: 17h44m00 - 17h49m30 utc
-
SPRB injections:
-
Injecting line at 17h56m25 utc with amp = 200, SPRB moving by +/-100 um, see Fig.11
-
Injecting line at 18h00m55 utc with amp = 300, SPRB moving by +/-150 um, see Fig.12
-
Injection stopped at 18h04m40 utc
-
The SPRB injection did not have any visible impact in DARM, and only a tiny effect on B4_DC.
The interferometer unlocked at 18h09m38 utc due to the timing issue, and it was not possible to relock until the end of the shift.
Data will be analyzed later.


